One of the three overarching goals for the Healthy People 2000 prevention initiative was to reduce health disparities among Americans.1 The framework of Healthy People 2010 has taken this a step further by proposing to “eliminate health disparities” as one of the two primary goals for the next decade.
To support this goal of eliminating health disparities, a single national target that is applicable to all select populations has been set for each measurable, population-based objective. Three guiding principles were used in setting targets for the measurable, population-based objectives:
n |
|
For objectives that address health services and protection (for example, access to prenatal care, health insurance coverage, etc.) the targets have been set so that there is an improvement for all racial/ethnic segments of the population (that is, the targets are set “better than the best” racial/ethnic subgroup shown for the objective). Data points for at least two population groups under the race and ethnicity category are needed to use “better than the best” as the target-setting method. |
n |
For objectives that can be influenced in the short term by policy decisions, lifestyle choices, and behaviors (for example, physical activity, diet, smoking, suicide, alcohol-related motor vehicle deaths, etc.), the target setting method is also “better than the best” group. | |
n |
|
For objectives that are unlikely to achieve an equal health outcome in the next decade, regardless of the level of investment (for example, occupational exposure and resultant lung cancer), the target represents an improvement for a substantial proportion of the population and is regarded as a minimum acceptable level. Implicit in setting targets for these objectives is the recognition that population groups with baseline rates already better than the identified target should continue to improve. |
Beyond this general guidance, the exact target levels were determined by the lead agency workgroups that developed the objectives. The workgroups used various methods for arriving at the target levels, including retention of the year 2000 target, computation of a statistical regression using current rates to project a target, knowledge of the programs currently in place and expected change, and expert judgment.
The following target-setting methods have been used:
n |
Better than the best. |
|
n |
__ percent improvement. |
|
n |
“Total coverage” or “Total elimination” (for targets like 100 percent, 0 percent, all States, etc.). |
|
n |
Consistent with __________________(another national program, for example, national education goals). |
|
n |
Retain year 2000 target (the Healthy People 2000 target has been retained). |
The specific method for developing the target is described under each objective in Healthy People 2010.2
Most objectives are tracked by a single measure. For these objectives, progress will be assessed by the change from the baseline measure toward the target. Some objectives seek to increase positive behaviors or outcomes while others are stated in terms of decreasing negative behaviors or outcomes.
A number of objectives contain multiple measures. Progress will be assessed separately for each measure. For these objectives, therefore, the progress may be mixed if some measures are progressing toward the target and others are regressing. Whenever possible, assessment of progress should consider the standard errors associated with the data (see section 9. Variability of Estimates).
For some objectives, precise measures that match the objective are not available. In these cases, similar proxy measures may be used to track progress. The tracking data and methods for assessing progress will be reviewed during the midcourse review in 2005, and a determination will be made at that time whether any changes will be made.
1. U.S. Department of Health and Human Services (HHS). Healthy People 2000: National Health Promotion and Disease Prevention Objectives. Washington, DC: HHS, Public Health Service (PHS), 1991.
2. HHS. Healthy People 2010. 2nd ed. With Understanding and Improving Health and Objectives for Improving Health. 2 vols. Washington, DC: U.S. Government Printing Office, November 2000.
Developmental objectives are those that currently do not have national baseline data (see Reader’s Guide section in Healthy People 20101) and, therefore, currently have no operational definitions. Some objectives that contain several measures may have parts that are developmental. Developmental objectives indicate areas that need to be placed on the national agenda for data collection. They address subjects of sufficient national importance that investments should be made over the next decade to measure their change.
A potential data source has been identified for all developmental objectives or subobjective measures. These sources, along with other information, will be discussed in the operational definitions under “Comments.” As data are developed and become available for these objectives, operational definitions will be disseminated on the Internet and/or in Healthy Peoplepublications. No targets have been set for developmental objectives; targets will be proposed at the midcourse review for those developmental objectives that have baseline data.
1. HHS. Healthy People 2010. 2nd ed. With Understanding and Improving Health and Objectives for Improving Health. 2 vols. Washington, DC: U.S. Government Printing Office, November 2000.
Healthy People 2010 uses population estimates from the U.S. Census Bureau to calculate morbidity and mortality rates for many of the objectives. Every 10 years, the Census Bureau conducts a full census of the resident population of the United States, Puerto Rico, and U.S. territories and collects data on gender, race, age, and marital status; the estimates produced represent the U.S. population as of April 1 of the census year. More detailed data on education, housing, occupation, income, and other information are also collected from a representative sample of the population (about 17 percent of the total population).1
The increasing diversity of the population has necessitated modification of the way race data are collected. In both the 1980 and 1990 censuses, a substantial number of persons did not specify a racial group that could be classified as any of the categories on the census form (white, black, American Indian, Eskimo, Aleut, Asian, or Pacific Islander).2 In 1980, the number of persons of “other” race was nearly 7 million; in 1990 it was almost 10 million. In both censuses, the majority of these persons were of Hispanic origin (based on response to a separate question on the form), and many wrote in their Hispanic origin, or Hispanic origin type (for example, Mexican, Puerto Rican) as their race.
The Census Bureau presents population data by race in two different ways. In decennial census publications, persons of unspecified race are maintained in the single category of “other.” For the purpose of providing comparable denominator data to other Federal and non-Federal data users, in both 1980 and 1990, the Census Bureau produced another set of population estimates for census years; in these population estimates, persons of unspecified race were allocated to one of the four tabulated racial groups (white, black, American Indian or Alaska Native, Asian or Pacific Islander), based on their response to the Hispanic question. These four race categories conform with Office of Management and Budget (OMB) Directive 153 and are more consistent with the race categories used in most major data systems, including vital statistics.4 The postcensal and intercensal population estimates described below are based on these “OMB-consistent” populations.
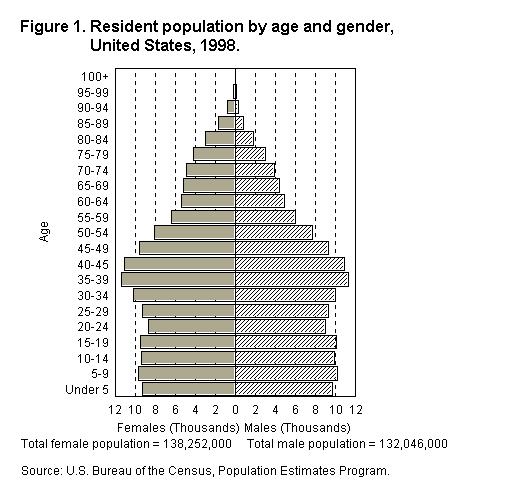
National population estimates for the years after the decennial census (postcensal estimates) are calculated using the decennial census as the base population and adjusting those counts using the following measures of population change: births and deaths (provided by the National Center for Health Statistics), immigration data (provided by the U.S. Immigration and Naturalization Service), data on the movement of Armed Forces personnel (from the U.S. Department of Defense [DoD]), movement between Puerto Rico and the U.S. mainland (from Puerto Rico Planning Board), and movement of Federal employees abroad (from the Office of Personnel Management and DoD). These estimates reflect the U.S. population as of July 1 of each year (see figure 1). Postcensal estimates for State and county populations are also calculated using these data, as well as data from the Internal Revenue Service and State departments of education. Postcensal estimates become less accurate as the date of the estimates moves farther from the date of the census.5
After the decennial population census, intercensal estimates for the preceding decade are calculated to replace postcensal estimates. These estimates reflect the population as of July 1. Intercensal estimates are more accurate than postcensal estimates because they incorporate data from the enumerations at the beginning and end of the decade. The intercensal estimates for the 1980s were used to revise some of the baselines for mortality objectives in Healthy People 2000; these were published in the Healthy People 2000 Midcourse Review and 1995 Revisions.6 The method that will be used to calculate intercensal estimates for the decade between 1990 and 2000 has not been developed because of the change in race and ethnicity data that will be collected in the year 2000 census (see section 4: Population Template). However, when the intercensal estimates for the decade become available, they will be used to recalculate some of the morbidity and mortality data for Healthy People 2010 baselines and tracking data for data years prior to the year 2000.
Some subgroups of the population (including some racial, ethnic, and age groups) are less likely than other groups to be completely enumerated in the decennial census. The undercounts of these groups lower the denominators and result in higher morbidity and mortality rates for these populations.7, 8 The Census Bureau makes estimates of net census undercount for the total, white, and black or African American populations by age. These estimates are then used to weight the populations used by most of the national health surveys, including National Health Interview Survey (NHIS), National Health and Nutrition Examination Survey (NHANES), the National Survey of Family Growth, and the National Health Care Surveys. The National Vital Statistics System (NVSS) (mortality and natality) use population denominators that are not adjusted for net census undercount.
Several types of target populations are used for Healthy People 2010objectives:
The resident population includes all persons whose usual place of residence is in one of the 50 States or the District of Columbia, including Armed Forces personnel stationed in the United States. The resident population is usually the denominator when calculating birth and death rates from the NVSS and incidence of disease rates from a number of data systems. The resident population is also the denominator for selected population-based rates that use numerator data from the National Nursing Home Survey.
The civilian population is the resident population, excluding members of the Armed Forces (although their family members are included). The civilian population is the denominator for other Healthy People 2010 data sources, such as the National Hospital Discharge Survey.
The civilian, noninstitutionalized population is the civilian population not residing in institutions (for example, correctional facilities, psychiatric hospitals, and nursing homes). This population is the denominator for rates from Healthy People data sources such as the National Ambulatory Medical Care Survey and the National Hospital Ambulatory Care Survey. This population is also used in the weighting procedure to produce national estimates from health surveys such as NHIS, NHANES, and the National Household Survey on Drug Abuse.
Details on the specific populations targeted for each major Healthy People 2010data system can be found in the data source tables included in Part C: Major Data Sources. The objective operational definitions shown in Part B indicate the population covered by each objective, if applicable.
1. Detailed information on the methodology used to collect census data is available from the U.S. Bureau of the Census Web site: http://www.census.gov.
2. U.S. Bureau of the Census. U.S. population estimates, by age, gender, race and Hispanic origin, 1980–91. Current Population Reports. Series P-25, No. 1095. Washington, DC: U.S. Department of Commerce, 1992.
3. Office of Management and Budget (OMB). Directive No. 15. Race and ethnic standards for Federal statistics and administrative reporting. Statistical Policy Handbook. Washington, DC: OMB, 1978.
4. National Center for Health Statistics (NCHS). Vital Statistics of the United States, 1992, Vol. I Natality. Technical appendix. Hyattsville, MD: U.S. Department of Health and Human Services (HHS), Public Health Service (PHS), 1996.
5. Byerly, E. R., and Deardorff, K. National and State Population Estimates: 1990 to 1994. U.S. Bureau of the Census, Current Population Reports, P25-1127. Washington, DC: U.S. Government Printing Office, 1995.
6. PHS. Healthy People 2000 Midcourse Review and 1995 Revisions. Washington, DC: HHS, 1995.
7. NCHS. Vital Statistics of the United States, 1992, Vol. II Mortality, Part A. Technical appendix. Hyattsville, MD: HHS, PHS, 1996.
8. Rosenberg, H.M.; Maurer, J.D.; Sorlie, P.D.; et al. Quality of death rates by race and Hispanic origin: A summary of current research, 1999. NCHS. Vital and Health Statistics 2(128), 1999.
During the review of the September 1998 Healthy People 2010 Draft for Public Comment,1 the need for greater consistency in tracking population groups became apparent. To address this issue, a minimum template for all Healthy People 2010 population-based objectives was adopted. Population-based objectives may show more detailed and additional breakouts if appropriate.
This minimum select population template applies to most currently measurable population-based objectives and will be applied to developmental population-based objectives (see section 2. Developmental Objectives) when data become available. The template does not apply to non-population-based objectives such as those that measure schools, worksites, or States. Because of problems in interpreting risk, the template is also not shown for population-based measurable objectives that are tracked using counts of events rather than rates or percents.
The minimum template for all population-based objectives is:
Race:
American Indian or Alaska Native
Asian or Pacific Islander
Asian
Native Hawaiian or Other Pacific Islander
Black or African American
White
Hispanic origin and race:
Hispanic or Latino
Not Hispanic or Latino
Black or African American
White
Gender:
Female
Male
Socioeconomic status:
Family income level- or Education level-
Poor Less than high school
Near poor High school graduate
Middle/high income At least some college
The groups listed under most headings (race, Hispanic origin, gender, and income) in the minimum template are comprehensive; that is, they are intended to sum to the population (excluding “unknowns”) tracked by the objective. For example, the three groups under income equal the total population tracked by the objective. The exception is the education category, which is limited to people of a minimum age or, in some cases, a maximum age (see Socioeconomic Status discussion below). The groups listed under the subheading “Not Hispanic or Latino” are not inclusive.
If data are not provided for a group, this is indicated by one of four statements: data have been collected but have not yet been analyzed (DNA), data are not collected by the data system used to track the objective (DNC), data are statistically unreliable (DSU), or the specific breakout is not applicable (NA). In cases where data for the entire template are not collected by the data system tracking the objective, a note to this effect will replace the template. For more information on statistical reliability, see section 9: Variability of Estimates.
On October 30, 1997, the Office of Management and Budget
(OMB) published “Standards for Maintaining, Collecting, and Presenting Federal
Data on Race and Ethnicity” (Federal Register, 62 FR 58781- 58790).2 The new standards revise OMB Directive No.
15, adopted on May 12, 1977,3 and modify
the data collection policy, making it possible for Federal agencies to collect
information that reflects the increasing diversity of our Nation’s population
stemming from growth in interracial marriages and immigration. As a result, the
ways that data on race are tabulated and analyzed also will become more
complex. Draft provisional tabulation guidelines, posted on the Internet at
http://www.whitehouse.gov/
WH/EOP/OMB/html/misc-doc.html, provide options for tabulating and for bridging
between data collected under the old and new standards.4
The new standards are being used by the U.S. Census Bureau in the 2000 decennial census. Other Federal programs are adopting the standards as soon as possible, but not later than January 1, 2003, for use in household surveys, administrative forms and records, and other data collections.
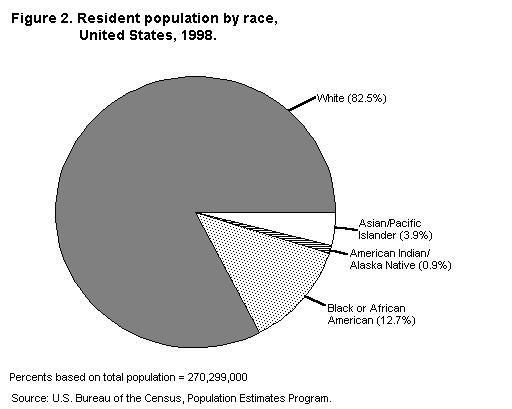
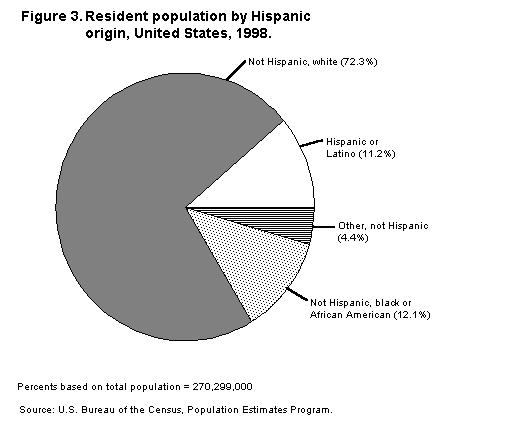
OMB Directive No. 15, still in effect as tracking of the Healthy People 2010 objectives begins, defined the basic racial and Hispanic origin categories for Federal statistics and program administrative reporting as American Indian or Alaska Native, Asian or Pacific Islander, Black, White, and Hispanic.3 The distribution of the U.S. population in 1998 by race and Hispanic origin is shown in figures 2 and 3, respectively, using the OMB Directive No. 15 categories. Although baselines and the first few years of tracking are guided by OMB 15, sometime during the decade the race and Hispanic origin classifications for objectives will change. Change in the categories is not expected to happen all at once, but will be implemented incrementally as data systems adopt the new standards and, if applicable, denominator data from the Census Bureau for rates and percentages become available.
The major changes to the reporting of data on race and Hispanic origin under the new guidelines are (1) the instruction to “mark one or more” racial categories, and (2) the dividing of the “Asian or Pacific Islander” category into two separate categories— “Asian” and “Native Hawaiian or Other Pacific Islander.” The new OMB standards also call for tabulating data for multiple races. Because these guidelines have generally not yet been implemented by most major health data systems, data for more than one race are not shown. When data are available for more than one race for most of the major Healthy People 2010data systems, they will be included in the tracking data. Also, most data systems currently do not produce data separately for the Asian and Native Hawaiian or Other Pacific Islander populations. Until data are tabulated for these groups, they will be shown as not collected.
Other changes include (1) “Hispanic” origin has been replaced by “Hispanic or Latino” (the preference remains for collecting these data in a separate question, the way it is presently being done on most Federal data collection forms), (2) Central and South American Indians, formerly not included in the “American Indian” category, are now included, and (3) the former “Black” category is replaced by “Black or African American.” Race and Hispanic origin may be reported in more detail for some objectives, subject to satisfying agency criteria for statistical reliability and confidentiality. For example, “Puerto Rican,” “Mexican,” and “Cuban” may be reported separately within the “Hispanic or Latino” group.
Under the new policy, agencies are required to offer respondents the option of selecting one or more of the following five racial categories included in the updated standards:
n |
American Indian or Alaska Native. A person having origins in any of the original peoples of North and South America (including Central America), and who maintains tribal affiliation or community attachment. |
|
n |
Asian. A person having origins in any of the original peoples of the Far East, Southeast Asia, or the Indian subcontinent including, for example, Cambodia, China, India, Japan, Korea, Malaysia, Pakistan, the Philippine Islands, Thailand, and Vietnam. | |
n |
Black or African American. A person having origins in any of the black racial groups of Africa. Terms such as “Haitian” or “Negro” can be used in addition to “Black or African American.” |
|
n |
Native Hawaiian or Other Pacific Islander. A person having origins in any of the original peoples of Hawaii, Guam, Samoa, or other Pacific Islands. |
|
n |
White. A person having origins in any of the original peoples of Europe, the Middle East, or North Africa. |
These five categories are the minimum set for data on race for Federal statistics, program administrative reporting, and civil rights compliance reporting. The new standards explicitly do not include an “other race” category for data collection; an “other” category may be used for tabulating and data reporting.3 Issues related to an “other” race category for census population data are discussed in section 3: Population Estimates. For Healthy People 2010, the designation “African American” will be used interchangeably with “Black or African American.”
The standards require that at a minimum, the total number of persons identifying with more than one race be reported when data are available. It is stressed that this is a minimum; the presentation of detailed information on specific racial combinations subject to constraints of data reliability and confidentiality standards is preferred. Based on preliminary research, it is estimated that less than 2 percent of the Nation’s total population is likely to identify with more than one race.3 Over time, this percentage may increase as those who identify with more than one race become aware of the opportunity to report more than one race group.
The standards regarding Hispanic origin provide for the collection of data on whether or not a person is of “Hispanic or Latino” culture or origin. This category is defined as follows:
Hispanic or Latino. A person of Cuban, Mexican, Puerto Rican, South or Central American, or other Spanish culture or origin, regardless of race. The term, “Spanish origin,” can be used in addition to “Hispanic or Latino.” Persons of Hispanic origin may be of any race and persons in the various race groups may be of any origin.
To provide flexibility and to assure data quality, the new OMB guidelines recommend that a two-question format (separate race and Hispanic ethnicity questions) be used, especially when self-identification is used. When race and ethnicity are collected separately, ethnicity should be collected first. Most Healthy People data systems that use self-identification, such as the National Health Interview Survey and the National Health and Nutrition Examination Survey, use the two-question format.
When self-identification is not feasible (for example, the National Notifiable Disease Surveillance System) or when there are overriding data collection considerations (for example, the Youth Risk Behavior Surveillance System), a combined race and ethnicity question can be used which includes a separate Hispanic category co-equal with the other (racial) categories. When a combined question is used, more than one entry (race and ethnicity or multiple races) is also possible.
Most health survey and census population data use the self-reported race of the respondent, which is considered the most accurate representation of a person’s racial or ethnic background. However, some data systems, such as the National Vital Statistics System (mortality), do not collect self-reported race or ethnicity of the decedent. In other systems, such as those derived from hospital/patient care records, it is often unclear whether the information is self-reported. In these cases, race and ethnicity may be entered by someone else (clerical staff, hospital personnel, etc.) based on the report of proxy respondents or by observation. Several of these data systems are discussed below.
National Vital Statistics System (Mortality)
Death rates by race and Hispanic origin may be biased from misreporting of race and Hispanic origin in the numerator of the rates and misreporting and undercoverage in the denominator of the rates.5 Numerator information is from the death certificate as reported by the funeral director based on information from an informant, usually a family member;6 while denominator information, from surveys or the Census of Population, is either self-reported or is reported by a member of the household. Based on comparisons of death certificate information with that from independent sources such as the Current Population Survey, the quality of reporting of race and Hispanic origin on the death certificate is good for the white and African American populations; however, reporting of other groups may be seriously under-reported.7 Additional reporting problems, such as net census undercount (see section 3: Population Estimates), affect population counts and estimates.8 As a consequence of the combined effect of numerator and denominator biases, it has been estimated that death rates for the white population are overestimated by about 1 percent and for the African American population by about 5 percent; and are underestimated for the American Indian or Alaska Native population by approximately 21 percent; Asian or Pacific Islanders, 11 percent; and Hispanics, 2 percent.5 These estimates are approximations; they do not take into account differential misreporting by age and sex among the race/ethnic origin groups.
For Healthy People 2010, infant mortality rates for races and ethnic populations are based on linked files of infant deaths and live births.9 These rates use the race of mother as self-reported on the birth certificate and, therefore, are not affected by the misreporting of race on the death certificate.
Data from systems that use patient records such as the National Hospital Discharge Survey (NHDS), the National Ambulatory Medical Care Survey, the National Hospital Ambulatory Medical Care Survey, the National Notifiable Disease Surveillance System, the HIV/AIDS Surveillance System, also may misreport the race of individuals. It is often unclear how race and ethnicity are reported in these systems. The race and ethnicity of the patient may be reported by hospital or other medical care personnel by observation, by proxy report, or by the patient. Therefore, one must use information on race and ethnicity from these systems with caution.
In addition to the problems of misreporting race and ethnicity, the information on race reported by some data systems are often missing or incomplete. Some of these systems are described below. Specific information on the quality and completeness of reporting of race and ethnicity for the major Healthy People 2010data systems is included, where available, in the data source description in Part C: Major Data Sources.
National Hospital Discharge Survey
Race is not reported in about 18 percent of NHDS records since data on race are not reported by many hospitals due to the omission of a race field on hospital discharge reporting forms.10 More hospitals have automated their discharge systems in recent years and are currently using form UB-92 which does not require race reporting. A comparison of NHDS data with data on persons who reported being hospitalized in the National Health Interview Survey (NHIS) (NHIS data were adjusted to exclude hospitalizations of 1 day or less) indicated that underreporting for the white patients was about 22 percent in 1991; the difference for African Americans was negligible.10 Hispanic origin is not reported for 85 percent of the NHDS records.
National Ambulatory Medical Care Surveys
For the National Ambulatory Medical Care Survey and the National Hospital Ambulatory Care Survey, race is not reported for about 11 percent of records.
National Notifiable Disease Surveillance System
Although staff in State health departments and CDC attempt to obtain complete demographic information associated with nationally notifiable cases of disease, some data (particularly for the variables of race and ethnicity) are not available for some cases of disease. Laws, regulations, and mandates for public health reporting (including specific data items that are reported) fall under the authority of individual States, and in some States, race and ethnicity may not be approved for reporting to the national level. Race and ethnicity data may also be unknown when cases are reported from a laboratory or when cases are reported as aggregate disease totals.
One of the three overarching goals for the Healthy People 2000 prevention initiative was to reduce health disparities among Americans.11 The proposed framework of Healthy People 2010has taken this a step further by proposing to “eliminate health disparities” as one of the two primary goals for the next decade. While disparities among racial and ethnic groups—especially between whites and African Americans—have received considerable attention over the last decade, differential health outcomes and access to social and health care resources often reflect differences in education, occupation, income, and wealth. Monitoring progress toward eliminating social and economic disparities in health over the next decade will require improved collection and use of standardized data on the socioeconomic status of individuals.
Socioeconomic status (SES) may be represented by income, level of education, or type of occupation. Healthy People 2010 primarily uses education and income-related measures. The following discussion presents data issues for income and education measures.
Income is the most common measure of socioeconomic status, and is probably the most relevant to health policy formulation. Current income provides a direct measure of the quality of food, housing, leisure-time amenities, and health care an individual is able to acquire, as well as reflecting the relative position in society. However, income may fluctuate over time so that income received in a given year may not accurately reflect one’s lifetime income stream or total wealth, the measures of resources more relevant to health. For example, elderly persons who have low incomes may also have accumulated assets that offset their need for a high annual income. Of particular importance in considering the relationship between income and health is the fact that income may be low because illness has limited the amount of income earned or prevented earning income entirely. The use of income as a measure of SES also involves more practical difficulties. In many heath surveys a substantial number of persons either do not know or refuse to report their incomes.12
For most objectives, income reflects total family income for a given reference period, usually the previous 12 months or last calendar year. However, some data systems, such as the Continuing Survey of Food Intakes by Individuals (CSFII), use the income of the household (which includes income of unrelated household members). These systems generally require household income for program purposes. When household income is used instead of family income this is noted in the template for the objective.
When income is selected for the template, poor, near poor, and middle/high income categories are used unless overridden by programmatic or data considerations (for example, Women, Infants, and Children (WIC) eligibility). In these special cases, the poverty categories appropriate for the program or system are used. For most health surveys, income is defined as money income before taxes and does not include the value of non-cash benefits such as food stamps, Medicare, Medicaid, public housing, and employer-provided fringe benefits.
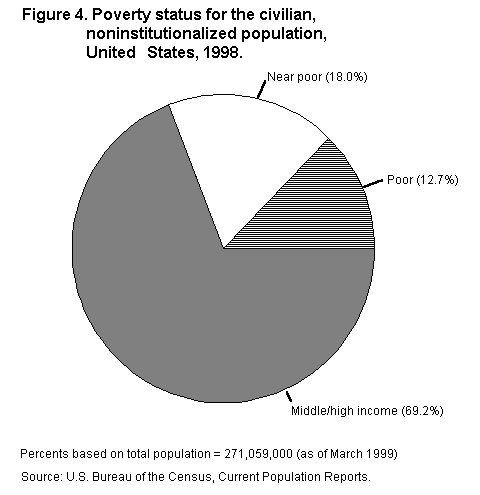
Converting income to poverty status adjusts for family size and inflation, facilitating comparisons among groups and over time. Poverty status measures family income relative to family size using the poverty thresholds developed by the U.S. Census Bureau, based on definitions originally developed by the Social Security Administration. These thresholds vary by family size and composition and are updated annually to reflect changes in the Consumer Price Index for all urban consumers. Families or individuals with income below their appropriate thresholds are classified as below the poverty level. Focusing simply on the dichotomy of “above” versus “below” poverty, however, obscures the full gradient of inequalities in income distribution and in health. Understanding burden across the income gradient provides information useful for potential eligibility expansions or other programmatic modifications. ForHealthy People 2010, the three categories of family level income that are primarily used (see figure 4 for the distribution of population by poverty status) are:
n |
Poor (below the Federal poverty level), |
|
n |
Near poor (100-199% of the Federal poverty level), and |
|
n |
Middle and high income (200% or more of the Federal poverty level) |
For a family of four, the average Federal poverty level weighted for family composition was $16,813 in 1998. Table 1 shows the 1998 poverty thresholds by size of family and number of related children under 18 years.
Table 1. Poverty thresholds in 1998, by size of family and number of related children under 18 years. |
|||||||||
Size of Family Unit |
Related Children Under 18 Years |
||||||||
|
None |
1 |
2 |
3 |
4 |
5 |
6 |
7 |
8 |
|
|
One person |
|||||||||
|
Under 65 years |
8,480 |
|
|
|
|
|
|
|
|
|
65 years and older |
7,818 |
|
|
|
|
|
|
|
|
|
Two persons |
|
||||||||
|
Householder under 65 years |
10,915 |
11,235 |
|
|
|
|
|
|
|
|
Householder 65 years and older |
9,853 |
11,193 |
|
|
|
|
|
|
|
|
Three persons |
12,750 |
13,120 |
13,133 |
|
|
|
|
|
|
|
Four persons |
16,813 |
17,088 |
16,530 |
16,588 |
|
|
|
|
|
|
Five persons |
20,275 |
20,570 |
19,940 |
19,453 |
19,155 |
|
|
|
|
|
Six persons |
23,320 |
23,413 |
22,930 |
22,468 |
21,780 |
21,373 |
|
|
|
|
Seven persons |
26,833 |
27,000 |
26,423 |
26,020 |
25,270 |
24,395 |
23,435 |
|
|
|
Eight persons |
30,010 |
30,275 |
29,730 |
29,253 |
28,575 |
27,715 |
26,820 |
26,593 |
|
|
Nine persons or more |
36,100 |
36,275 |
35,793 |
35,388 |
34,723 |
33,808 |
32,980 |
32,775 |
31,513 |
|
Note: Numbers represent income in U.S. dollars. Source: U.S. Bureau of the Census. |
|||||||||
In addition to the limitations discussed for income, converting income to poverty status introduces other issues that need to be considered. If income data are collected by selecting an appropriate income category, rather than giving the actual dollar amount, then the conversion to poverty status must be performed using category means or medians and will thus result in some misclassification.
The process of setting the official poverty definitions is currently being reevaluated. In 1990, a committee of the U.S. Congress requested that the National Academy of Science/National Research Council (NRC) conduct a study of the official poverty measure. In the final report issued in 1995, the NRC’s Panel on Poverty and Family Assistance proposed a new approach for developing an operational definition of poverty. The proposed poverty measure would incorporate more broadly defined thresholds and a new definition of family resources (income) that includes the value of non-cash benefits such as food stamps, Medicare, Medicaid, public housing, and employer-provided fringe benefits and deducts work-related and medical expenses. The Census Bureau is currently conducting an extensive examination of the Panel’s recommendations and alternative procedures. Revising the official U.S. poverty measure could have implications for data collection and trend analysis in Healthy People 2010.
Education is frequently used as the measure of SES in presentations of health data. There are several reasons for this preference. Education is generally more completely reported than income; usually 95 percent or more of respondents report their attained level of education. Unlike occupation, all adults may be characterized by their education level. Education, unlike income or occupation, remains fixed for most people after the age of 25 and usually is not influenced by health. In addition, education is highly related to both income and occupation.
Education cannot be used to characterize the socioeconomic position of children (except through the educational level of parents or head of household), and the average education level of the U.S. population has increased steadily over time, complicating comparisons across age groups. Between 1971 and 1997, the educational attainment of persons aged 25 to 29 years completing high school rose from 78 to 87 percent; the percentage with some college rose from 44 to 65 percent; and the percentage with 4 or more years of college rose from 22 to 32 percent.13
Educational attainment is typically measured either by the number of years of education the individual has completed or by the highest credential received (see figure 5). The categories for educational attainment that are primarily used in Healthy People 2010 are:
n |
Less than high school (persons with less than 12 years of schooling or no high school diploma), |
|
n |
High school graduate (persons with either 12 years of schooling, a high school diploma, or general equivalency diploma [GED], and |
|
n |
At least some college (persons with a high school diploma or GED and 13 or more years of schooling). |

In general, data on educational attainment are presented for ages beginning
with 25 years, consistent with guidance given by the U.S. Census Bureau.
However, objectives using different data systems may have different age groups
for the education variable. The actual ages that are used to calculate
educational attainment for some of the major Healthy People 2010 data systemsare shown in Table 2. Because of the
requirements of the different data systems, the age groups used to calculate
educational attainment for an objective may differ from the age groups used to
report the data for other select populations and the overall measure of the
same objective. For clarity, each objective in Healthy People 2010 states the
age groups used to measure the levels in the educational attainment category
and caution must be used in comparing the data by educational attainment with
data for the main objective and other select populations.
Healthy People 2010 baseline education data for the mortality objectives are based on reports from 46 States and the District of Columbia. Mortality statistics do not report data by education for the elderly population (65 years and older) because the percentage with “education not stated” is higher for this group and because of possible bias due to misreporting of education on the death certificate. Misreporting of education on the death certificate tends to overstate the death rate for high school graduates (12 years of education) because there is a tendency for some people who did not graduate from high school to be reported as high school graduates on the death certificate; by extension, the death rate for the group with less than 12 years of education tends to be understated.14
Table 2. Healthy People 2010 data systems and ages used to report educational attainment. |
|
Several other groups were considered for inclusion in the minimum set of select populations but were left to the discretion of the workgroups to include under specific objectives where appropriate. These groups included urban/rural residence, health insurance status, disability status, age, sexual orientation, the institutionalized population, and immigrant status, some of which are discussed in greater detail below. Some objectives also include select populations of persons with specific conditions—such as persons with diabetes, persons with hypertension, and persons with arthritis.
Urban residence in Healthy People 2010is specified as either residing within or outside a metropolitan statistical area (MSA) or residing within or outside an urbanized area (UA) or urban place (called “urban” in the template) as designated by the U.S. Census Bureau (see figure 6 for a distribution of population by metropolitan and non-metropolitan residence).
Urban residence is defined as people living within the boundaries of an UA and the urban portion of places outside an UA that have a decennial census population of 2,500 or more. An UA is an area consisting of a central place(s) and adjacent urban fringe that together have a minimum residential population of at least 50,000 people and generally an overall population density of at least 1,000 people per square mile of land area. The U.S. Census Bureau uses published criteria to determine the qualification and boundaries of UA’s. For more information see the Census Bureau Web site at http://www.census.gov/geo/www/tiger/glossary.htm.
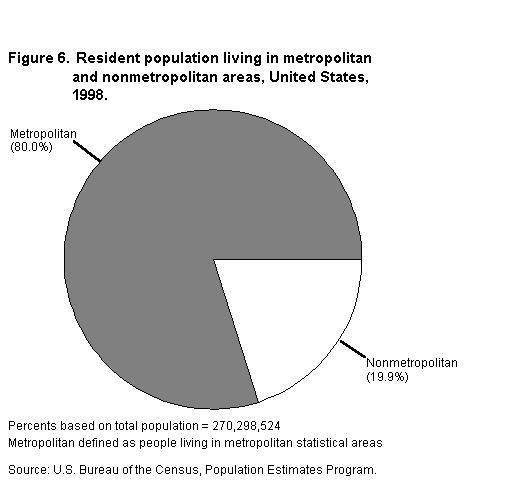
Metropolitan Statistical Areas (MSA’s)
Metropolitan statistical areas (MSA’s) are established by the U.S. Office of Management and Budget (see figure 6). The MSA standards are revised before each decennial census. When census data become available, the standards are applied to define the actual MSA’s. An MSA is a county or group of contiguous counties that contains at least one city with a population of 50,000 or more or includes a U.S. Census Bureau-defined urbanized area of at least 50,000 with a metropolitan population of at least 100,000. In addition to the county containing the main city or urbanized area, an MSA may contain other counties that are metropolitan in character and are economically and socially integrated with the central counties. In New England, cities and towns, rather than counties, are used to define MSA’s. A rural residence, using the MSA standard, is defined as residing outside of an MSA. For further information on MSA’s, see U.S. Department of Commerce, U.S. Census Bureau, State and Metropolitan Area Data Book.15
Health insurance information applies only to persons aged under 65 years. Those 65 years and older are considered to be covered by Medicare. Respondents are considered to have health insurance if they are covered by either private or public health plans. Private insurance includes fee-for-service plans, single service hospital plans, and coverage by health maintenance organizations (HMO’s). Public insurance includes Medicaid or other public assistance, Aid for Families with Dependent Children (AFDC), Supplementary Security Income (SSI), Medicare, or military health plan coverage.
In 1980, the World Health Organization (WHO) published the first version of the International Classification of Impairments, Disabilities, and Handicaps (ICIDH) as a classification of the “consequences of disease.” The new version, ICIDH-2, a classification of functioning and disability, is currently undergoing field testing worldwide with a May 2001 target date for implementation.16
According to ICIDH-2, components of disability include:
n |
losses or abnormalities of bodily function and structure (impairments), |
|
n |
limitations of activities, |
|
n |
restrictions in participation (formerly called handicaps), |
|
n |
barriers and facilitators which make up the physical, social and attitudinal environment (environmental factors). |
The major sources of national data on people with disabilities include:
n |
Decennial Census |
|
n |
Survey of Income and Program Participation (SIPP) |
|
n |
National Health Interview Survey (NHIS) |
|
n |
National Health and Nutrition Examination Survey (NHANES) |
|
n |
Medical Expenditure Panel Survey (MEPS) |
|
n |
Current Population Survey (CPS) |
For Healthy People 2010, the major sources of disability data are the NHIS and NHANES for national data and the Behavioral Risk Factor Surveillance System (BRFSS) for State-level data. The NHIS has several variables that can be used to operationally define disability status, including limitation of activity, restriction of participation (bed days, work-loss days, school-loss days), and assessed health status.17 The NHIS was redesigned in 1997 and many of the variables, especially limitation of activity, may be somewhat different than those collected by the survey before 1997. The BRFSS also collects information on health-related quality of life, limitation of activity, and self-assessed health status.
Disability is operationally defined in a number of different ways for program purposes and for analytic and research purposes, depending on the data collected by the data systems. In Healthy People 2010, disability is primarily defined using information on activity limitation or the use of special equipment. The following are the definitions used for NHIS, BRFSS, and NHANES measures.
For the 1997 NHIS, a person is classified as having a disability if a “yes” response was obtained to any of the age-appropriate limitation questions or to the use of special equipment. (See the operational definition for the denominators used for objectives 6-2 (children) and 6-3 (adults) in Part B for the specific questions used from the 1997 NHIS.)
For NHIS data prior to 1997, the special equipment questions were not asked, so persons are categorized in the templates as “with activity limitation” rather than “with disabilities.”
State data are available from the BRFSS telephone surveys. For Healthy People 2010, using 1998 BRFSS data, people answering “yes” to any of the following questions define adults 18 years and older with disabilities:
n |
Are you limited in any way in any activities because of any impairment or health problem? |
|
n |
If you use special equipment or help from others to get around, what type do you use? |
Disability data from the NHANES are limited to the second phase of NHANES III (1991–94) and are calculated only for people 20 years and older. People are classified as having a disability if a “yes” response was obtained to any of the following questions:
n |
Are you limited in the kind or amount of work you can do because of any impairment or health problem? |
|
n |
Are you limited in the kind or amount of housework you can do because of any impairment or health problem? |
|
n |
Are you limited in any way in any activities because of any impairment or health problem? |
|
n |
Do you usually use any device to help you get around such as a cane, wheelchair, crutches or walker? |
The Centers for Disease Control and Prevention (CDC) has proposed that a standardized set of questions on disability status be developed. As standard questions are adopted by the data systems, the data produced from them will be incorporated into the Healthy People 2010 objectives that specifically identify people with disabilities. This presents the opportunity in the future to have a standard definition of people with disabilities that can be used across data systems and geographic levels. Objective 6-1 of Healthy People 2010 will track the incorporation of a standard definition in data systems used to monitor the Healthy People 2010 objectives.
To a large extent, disability measures are related to the generation of many summary measures discussed in the goals section of Healthy People 2010: Understanding and Improving Health.18 Summary measures of health generally combine information on mortality and health into a single measure. Many of these summary measures use variables that directly relate to disability status to generate the health component (often referred to as health-related quality of life) of the measure. Because of this, disability measures have importance beyond the assessment of the disability status of a population.
Age is not included in the minimum template because to show inclusive age categories would add considerable complexity to the minimum set. Furthermore, age is often stated in the objective (for example, mammograms for females 40 years and older) and many objectives are relevant only for a subset of age groups. Age-specific select populations are added to objectives where needed and may not be inclusive of the total population. For example, data lines for the elderly, adolescents, or children have been added to some objectives without adding other groups, although showing inclusive age breakouts, if relevant, is preferred.
1. U.S. Department of Health and Human Services (HHS). Healthy People 2010 Objectives: Draft for Public Comment. Washington, DC: HHS, Office of Public Health and Science, 1998.
2. Office of Management and Budget (OMB). Standards for maintaining, collecting, and presenting Federal data on race and ethnicity. Federal Register, 62 FR 58781-58790, 1997.
3. OMB. Directive No. 15. Race and Ethnic Standards for Federal Statistics and Administrative Reporting. Statistical Policy Handbook. Washington, DC: OMB, 1978.
4. OMB. Tabulation Working Group of the Interagency Committee for the Review of Standards for Data on Race and Ethnicity. Draft Provisional Guidance on the Implementation of the 1997 Standards for the Collection of Federal Data on Race and Ethnicity. <http://www.whitehouse.gov/WH/EOP/OMB/html/misc-doc.html>February 17, 1999.
5. Rosenberg, H.M.; Maurer, J.D.; Sorlie, P.D.; et al. Quality of death rates by race and Hispanic origin: A summary of current research, 1999. National Center for Health Statistics (NCHS). Vital and Health Statistics 2(128), 1999.
6. NCHS. Vital Statistics of the United States, 1992, Vol. II, Mortality, Part A. Technical appendix. Hyattsville, MD: HHS, Public Health Service (PHS), 1996.
7. Sorlie, P.D.; Rogot, E.; and Johnson, N.J. Validity of demographic characteristics on the death certificate. Epidemiology 3(2):181-184, 1992.
8. Hogan, H. The 1990 Post-enumeration survey: Operations and results. Journal of the American Statistical Association 88(423):1047-1060, 1993.
9. MacDorman, M.F., and Atkinson, J.O. Infant Mortality Statistics from the 1996 Period Linked Birth/Infant Death Data Set.Monthly Vital Statistics Report. Vol. 46. No. 12. Hyattsville, MD: NCHS, 1998.
10. Kozak, L.J. Underreporting of Race in the National Hospital Discharge Survey.Advance Data from Vital and Health Statistics No. 265. Hyattsville, MD; NCHS, 1995.
11. HHS. Healthy People 2000: National Health Promotion and Disease Prevention Objectives. Washington, DC: HHS, PHS, 1991.
12. NCHS. Health United States, 1998, With Socioeconomic Status and Health Chartbook. Hyattsville, MD: HHS, 1998.
13. U.S. Department of Education. The Condition of Education 1998: Indicator 22: Educational Attainment. Jessup, MD: National Center for Education Statistics, 1998.
14. Sorlie, P.D., and Johnson, N.J: Validity of education information on the death certificate. Epidemiology 7(4):437-439, 1996.
15. U.S. Department of Commerce (DOC), Bureau of the Census. State and Metropolitan Area Data Book 1997–98. Washington, DC: DOC, 1999.
16. World Health Organization (WHO). ICIDH-2: International Classification of Functioning and Disability: Beta-2 Draft, Full version. 5-28, 185-212. Geneva, Switzerland: WHO, 1999. <http://.who.int/icidh>
17. NCHS. Current estimates from the National Health Interview Survey, 1995. Vital and Health Statistics10(199), 1998.
18. HHS. Healthy People 2010: Understanding and Improving Health. 2nd ed. Washington, DC: U.S. Government Printing Office, November 2000.
Because many objectives in Healthy People 2010 have outcomes that vary by age, data for a number of objectives are age adjusted to control for differences due only to differences in age composition. Age adjustment, using the direct method, is the application of age-specific rates in a population of interest to a standardized age distribution in order to eliminate differences in observed rates that result from age differences in the population composition. This adjustment is usually done when comparing two or more populations (such as race/ethnic groups) at one point in time or one population at two or more points in time.
Age-adjusted rates are useful for comparison purposes only, not to measure absolute magnitude. (To compare absolute magnitude, numbers or crude rates are used.) The actual numerical value of an age-adjusted rate is dependent on the standard population used and, therefore, has no intrinsic meaning. Because age-adjusted rates are adjusted to a predetermined standard, they should be viewed as constructs or indexes rather than as direct or actual measures. It is important to note that in order to compare age-adjusted rates they must be adjusted to the same standard population.1
For the Healthy People 2000 objectives, age adjustment was used for most of the mortality objectives and only for a very few selected other objectives. For Healthy People 2010, age adjustment is used again for most of the mortality objectives but also for many objectives that measure health outcomes and risk factors. Age-adjusted data may be shown for objectives that target either the total population or a groups with a large age range. Objectives or population subgroups that target groups with relatively small age ranges (generally less than 40 years) are not adjusted.
For some population groups, the age-adjusted rates are considerably different than crude rates. This happens because the population distribution of the group is quite different from the distribution of the standard population, which, for most objectives, is based on the projected year 2000 population for the entire United States. For example, for the Hispanic population (especially Mexican Americans) the age-adjusted rates for many outcomes and behaviors that are generally more frequent among the older population are considerably higher than the crude rates. This occurs because the Hispanic population has a much younger age distribution than the standard population.
Age-adjusted baseline data are noted in Healthy People 20102 and in Part B: Operational Definitions. Any data not specifically denoted as age adjusted, should be considered crude (unadjusted) data.
There are about 40 Healthy People 2010 objectives that monitor mortality outcomes. Most of these objectives use data from the National Vital Statistics System (NVSS) of which 26 use death rates age adjusted by the direct method, to the 2000 standard population (see Appendix C). The other mortality objectives are measured using either:
n |
Numbers of deaths |
|
n |
Age-specific death rates |
|
n |
Maternal/infant rates, which use births as the denominator, or |
|
n |
Crude death rates from other systems such as the Fatality Analysis Reporting System or the Census of Fatal Occupational Injuries |
The details of measurement will be specified in the operational definition for each objective.
The age-adjusted death rate (AADR) is a weighted average of the age-specific death rates where the age-specific weights represent the relative age distribution of a standard population. The AADR is calculated by the direct method using the following formula:2
AADR = å wsi × Ri
where Ri is the age-specific death rate for age interval i and wsi denotes the standard weight for age interval i such that
| wsi = | Psi |
| —— | |
| å Psi |
where Psi
denotes the population in age interval i
in the standard population, 0< wsi<1, and the wsi
sum to 1.
Selection of the standard age distribution, or standard population, is to some extent arbitrary.3, 4 At least three different standards have been widely used over the years by Federal and State statistical agencies. Beginning with the analyses of data collected in 1999, all agencies of the U.S. Department of Health and Human Services (DHHS) will use a single standard based on a projection of the year 2000 U.S. population.5, 6 Use of a single and more contemporary population standard helps reduce perceptions that the previously used standards are outdated, as well as confusion and misunderstanding among data users and the media when multiple data standards were used by the Department of Health and Human Services.5 Moreover, reflecting the current population structure, the new standard results in death rates that more closely approximate the average risk of death reflected in crude death rates.
Age-adjusted death rates for 1997 and 1998 used for Healthy People 2010 baseline data are based on the 2000 population standard. Therefore, they differ from rates shown in previous Healthy People 2000 reports,7 which show rates based on the 1940 standard population. Healthy People 2010 is showing rates adjusted to the 2000 standard before implementation of the new standard by most other agencies and publications. Therefore, the Healthy People 2010baseline data will differ from those published in Health, United States, or the National Vital Statistics Report. To assist with the transition from the 1940 to the 2000 standard, the baseline 2010 rates adjusted to 1940 for the applicable mortality objectives are included in Appendix C.
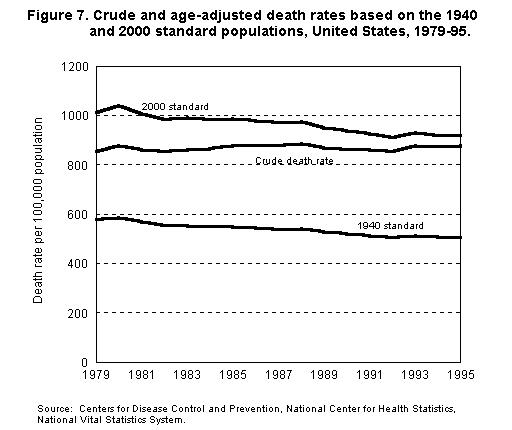
Changing to the 2000 standard has implications for the interpretation of mortality trends and comparisons. Figure 7 shows the trend in mortality for the crude death rate and the age-adjusted death rates based on the 1940 and 2000 standard.6 The age-adjusted death rate based on the 2000 standard for recent years much more closely reflects the observed average risk of mortality (represented by the crude death rate) than the rate adjusted to 1940. The age-adjusted rate based on the 2000 standard population is larger because the 2000 population, which has an older age structure than the 1940 population, gives more weight than the 1940 standard to death rates at the older ages where mortality is higher. The trend lines for the age-adjusted total mortality rates are roughly parallel, showing decreases in age-adjusted rates that are similar for the period 1979 through 1995. However, trends for some causes of death may differ. For Healthy People this means that the rates computed for Healthy People 2000 cannot be used in trend comparisons with rates computed for Healthy People 2010.
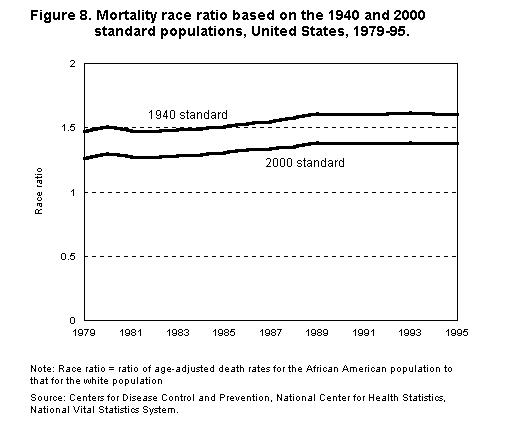
Table 3. 2000 standard million age distribution. |
|||
Age |
Population |
Standard Million |
Proportion Distributions (wsi) |
|
All ages |
274,634 |
1,000,000 |
1.000000 |
|
Under 1 year |
3,795 |
13,818 |
0.013818 |
|
1-4 years |
15,192 |
55,317 |
0.055317 |
|
5-14 years |
39,977 |
145,565 |
0.145565 |
|
15-24 years |
38,077 |
138,646 |
0.138646 |
|
25-34 years |
37,233 |
135,573 |
0.135573 |
|
35-44 years |
44,659 |
162,613 |
0.162613 |
|
45-54 years |
37,030 |
134,834 |
0.134834 |
|
55-64 years |
23,961 |
87,247 |
0.087247 |
|
65-74 years |
18,136 |
66,037 |
0.066037 |
|
75-84 years |
12,315 |
44,842 |
0.044842 |
|
85 years and older |
4,259 |
15,508 |
0.015508 |
Source: U.S. Census Bureau, Population Estimates Program. |
|||
A number of other Healthy People 2010 objectives use data from national health surveys that are also age adjusted. These are specified in Healthy People 20102and in the operational definition for each objective. These include objectives tracked by the National Health Interview Survey (NHIS), the Medical Expenditure Panel Survey (MEPS), the National Hospital Discharge Survey (NHDS), the National Ambulatory Medical Care Survey (NAMCS), the National Hospital Ambulatory Medical Care Survey (NHAMCS), the Behavioral Risk Factor Surveillance System (BRFSS), the Continuing Survey of Food Intakes by Individuals (CSFII), and the National Health and Nutrition Examination Survey (NHANES). Data for these objectives are also age adjusted to the 2000 standard population, using the equations previously shown where Ri is the age-specific rate for the health status, health behavior, or health care utilization variable, as appropriate.
However, the age groups used to adjust the survey data may be somewhat different from those used to adjust mortality data. In general, to maximize the stability of the rates, fewer age groups are used. Differences resulting from the specific age groups used should be relatively small. In some cases, the applicable age range for the objective may not be the total population. For example, an objective may refer to persons aged 18 years and older, females aged 40 years and older, or persons aged 45-74 years, etc. In these cases, the weights are recomputed for applicable age groups so that they total to 1 (or 1,000,000).
The following age groups were used for the major data systems shown in Table 4. The specific grouping used depends on the age group targeted by the objective.
Table 4. Age groups used to age adjust from selected major Healthy People 2010 data systems. |
|||||
Data System |
Age Grouping |
||||
|
NHIS |
(All Ages) |
(Ages 2+) |
(Ages 18+) |
(Ages 18+) |
(Ages 25+) |
|
BRFSS |
0-17 |
2-17 |
18-24 |
18-24 |
25-34 |
|
MEPS |
18-44 |
18-44 |
25-34 |
25-44 |
35-44 |
|
|
45-54 |
45-54 |
35-44 |
45-64 |
45-64 |
|
|
55-64 |
55-64 |
45-64 |
65+ |
65+ |
|
|
65-74 |
65-74 |
65+ |
|
|
|
|
75+ |
75+ |
|
|
|
|
|
|
|
|
|
|
|
|
(Ages 40+) |
(Ages 45+) |
(Ages 50+) |
(Ages 65+) |
(Ages 0-17) |
|
|
40-49 |
45-49 |
50-64 |
65-74 |
0-4 |
|
|
50-64 |
50-64 |
65+ |
75+ |
5-11 |
|
|
65+ |
65+ |
|
|
12-17 |
|
|
(Ages 18-64) |
|
|
|
|
|
|
18-24 |
|
|
|
|
|
|
25-34 |
|
|
|
|
|
|
35-44 |
|
|
|
|
|
|
45-64 |
|
|
|
|
|
NHANES |
(All Ages) |
(Ages 2+) |
(Ages 18+) |
(Ages 18+) |
(Ages 25+) |
|
CSFII |
0-12 |
2-5 |
12-19 |
18-29 |
20-29 |
|
|
12-19 |
6-11 |
20-29 |
30-39 |
30-39 |
|
|
20-29 |
12-19 |
30-39 |
40-49 |
40-49 |
|
|
30-39 |
20-29 |
40-49 |
50-59 |
50-59 |
|
|
40-49 |
30-39 |
50-59 |
60-69 |
60-69 |
|
|
50-59 |
40-49 |
60-69 |
70-79 |
70-79 |
|
|
60-69 |
50-59 |
70-9 |
80+ |
80+ |
|
|
70-79 |
60-69 |
80+ |
|
|
|
|
80+ |
70-79 |
|
|
|
|
|
|
80+ |
|
|
|
|
(Ages 20+) |
|
|
|
|
|
|
|
20-39 |
|
|
|
|
|
|
40-59 |
|
|
|
|
|
|
60+ |
|
|
|
|
|
|
|
|
|
|
|
|
NAMCS |
(All Ages) |
(Ages 20+) |
|
|
|
|
NHAMCS |
0-18 |
20-44 |
|
|
|
|
|
18-44 |
45-64 |
|
|
|
|
|
45-64 |
65+ |
|
|
|
|
|
65-74 |
|
|
|
|
|
|
75+ |
|
|
|
|
|
NHDS |
(All Ages) |
(Ages 65+) |
(Age 0-64) |
(Ages 5-64) |
|
|
|
0-18 |
65-74 |
0-17 |
5-17 |
|
|
|
18-44 |
75+ |
18-44 |
18-44 |
|
|
|
45-64 |
|
45-64 |
45-64 |
|
|
|
65-74 |
|
|
|
|
|
|
75+ |
|
|
|
|
A reference list based on the projected 2000 population from which weights can be computed to age-adjust data for virtually all Healthy People 2010 objectives is shown below in Table 5:
Table 5. 2000 population projections by age (in thousands). |
|||
Age |
Population |
Age |
Population |
|
Total |
274,634 |
|
|
|
Under 1 year |
3,795 |
30-34 years |
19,511 |
|
1 year |
3,759 |
35-39 years |
22,180 |
|
2-4 years |
11,433 |
40-44 years |
22,479 |
|
5 years |
3,896 |
45-49 years |
19,806 |
|
6-8 years |
11,800 |
50-54 years |
17,224 |
|
9 years |
4,224 |
55-59 years |
13,307 |
|
10-11 years |
8,258 |
60-64 years |
10,654 |
|
12-14 years |
11,799 |
65-69 years |
9,410 |
|
15-17 years |
11,819 |
70-74 years |
8,726 |
|
18-19 years |
8,001 |
75-79 years |
7,415 |
|
20-24 years |
18,257 |
80-84 years |
4,900 |
|
25-29 years |
17,722 |
85 years and older |
4,259 |
|
Source: U.S. Bureau of the Census, Population Estimates Program. |
|||
More information on the age groups used to adjust and the weights used for specific data systems can be found in Health, United States.8
1. Shryock, H.S., and Siegel, J.S. The Methods and Materials of Demography. San Diego, CA: Academic Press, 1976.
2. U.S. Department of Health and Human Services (HHS). Healthy People 2010. 2nd ed. With Understanding and Improving Health and Objectives for Improving Health. 2 vols. Washington, DC: U.S. Government Printing Office, November 2000.
3. Feinleib, M., and Zarate, A.O., eds. Reconsidering Age Adjustment Procedures: Workshop Proceedings. Vital and Health Statistics 4(29), 1992.
4. Curtin, L.R.; Maurer, J.; and Rosenberg, H.M. On the selection of alternative standards for the age-adjusted death rate. Proceedings of the Social Statistics Sections, American Statistical Association 218-223, 1980.
5. Anderson, R.N., and Rosenberg, H.M. Report of the Second Workshop on Age Adjustment.Vital and Health Statistics4(30), 1998.
6. Anderson, R.N., and Rosenberg, H.M. Age Standardization of Death Rates: Implementation of the Year 2000 Standard. National Vital Statistics Reports. Vol. 47, No. 3. Hyattsville, MD: NCHS, 1998.
7. Curtin. L.R., and Klein, R.J. Direct Standardization (Age-Adjusted Death Rates). Statistical Notes No. 6 revised. Hyattsville, MD: NCHS, 1995.
8. NCHS. Health, United States, 2000 With Adolescent Health Chart Book. Hyattsville, MD: NCHS, 2000.
Baseline data for mortality objectives for specific causes of death in this report are classified and coded according to the World Health Organization’s (WHO) Ninth Revision of the International Classification of Diseases (ICD-9)1 that was implemented in the United States effective with deaths occurring in 1979. The specific ICD-9 codes used are included in the operational definition for each mortality objective. Beginning with deaths occurring in January 1999, the Tenth Revision of the ICD will be used (ICD-10).2
Since the beginning of the century, the ICD for mortality has been modified about once every 10 years, except for the 20-year interval between the last two revisions, ICD-9 and ICD-10. The purpose of the revisions is to stay abreast with medical advances in terms of disease nomenclature and etiology.
The ICD is a classification system for causes of death, which includes (1) coding rules for causes of death that allow a medical coder to identify the underlying cause of death on the death certificate that is considered most informative from a public health point of view; (2) definitions for concepts like “underlying cause of death;” (3) tabulation lists that indicate the cause-of-death groupings that countries should use to present mortality data that can be compared with other countries; and (4) the prescribed format of the medical certification section of the death certificate. Use of the ICD for classification and coding of mortality is required under an agreement between the United States and WHO.
Data for most Healthy People 2010 mortality objectives are based on the underlying cause of death. The underlying cause of death is defined by WHO as the disease or injury that initiated the sequence of events leading directly to death or as the circumstances of the violence or accident that produced the fatal injury.1 It is selected from the conditions entered by the physician in the cause of death section on the death certificate. When more than one cause is entered by the physician, the underlying cause is determined by the sequence of conditions on the certificate, provisions of the ICD, and associated selection rules and modifications.3 Generally, more information is reported on the death certificate than is directly reflected in the underlying cause of death. This is captured in the multiple cause-of-death statistics. Several objectives use all mentions of a cause (or “multiple” cause) on the death certificate. Details on the ICD-9 codes used for the baseline for the Healthy People 2010 objective and whether the data used are underlying or multiple cause will be found in the operational definition for each mortality objective and also summarized in Appendix D.
ICD-10 differs from ICD-9 in a number of respects: (1) ICD-10 is far more detailed than ICD-9, about 8,000 categories compared with 4,000 categories, mainly to provide more clinical detail for morbidity (illness) applications; (2) ICD-10 uses 4-digit alpha-numeric codes compared with 4-digit numeric codes in ICD-9; (3) three additional chapters have been added, some chapters rearranged, cause of death titles have been changed, and conditions have been regrouped; and (4) some coding rules have been changed.
The ICD-10 cause-of-death categories are reflected in ICD-10 tabulation lists created by the National Center for Health Statistics (NCHS) in collaboration with other Federal agencies and the States. A total of eight tabulation lists were developed for ICD-10, the most detailed of which includes each of the 4-digit categories that are valid for underlying cause of death. Replacing the widely used ICD-9 list of 72 selected causes of death plus HIV and Alzheimer’s is the ICD-10 tabulation list of 113 Selected Causes of Death. This list, which will be used to identify and rank the leading causes of death, will also be used, wherever possible, to track the Healthy People 2010 mortality objectives.
The lists are published in the NCHS Instruction Manual, Part 9.4 They can be accessed through the NCHS mortality Web site at the following address:
http://www.cdc.gov/nchs/about/major/dvs/im.htm
Introduction of a new revision of the ICD creates discontinuities—some serious—in time series trends for causes of death, because of the reclassification of diseases and changes in the coding rules. Therefore, the causes of death used for the 1997 and 1998 baselines in the initial Healthy People 2010 report will not be strictly comparable with the tracking data for 1999 and subsequent years.
When graphically displaying mortality data across revisions of the ICD, it is helpful if trend lines be broken at the point in time that the new ICD revision was introduced to emphasize the discontinuities resulting from the change in revision.3 The extent of the discontinuity is measured using a “comparability ratio,” which results from double-coding a large sample of the national mortality file, once by the old revision (ICD-9), and again by the new revision (ICD-10), and expressing the results of the comparison as a ratio of deaths for a cause of death by the later revision divided by the number of that cause of death coded and classified by the earlier revision.5 Preliminary comparability ratios for causes of death between ICD-9 and ICD-10 will be published by NCHS in the year 2000. In subsequent Healthy People 2010 reports, information will be provided on the comparability of the ICD-9 baseline data and the ICD-10 tracking data for Healthy People 2010 objectives that are affected.
The NCHS Web site for ICD-10 for mortality is as follows:
http://www.cdc.gov/nchs/about/major/dvs/icd10des.htm
Data for theHealthy People 2000mortalityobjectives were also coded according to ICD-9, although in a few cases, the specific codes used for the 2010 objectives are different from those used for the comparable Healthy People 2000objective. These differences are noted in the operational definition for the objective in Part B: Operational Definitions.
Baseline data for morbidity objectives from sources such as the National Hospital Discharge Survey, National Ambulatory Medical Care Survey, and the National Hospital Ambulatory Care Survey are coded to International Classification of Diseases, 9th Revision, Clinical Modification (ICD-9-CM).6 The specific ICD-9-CM codes used will be included in the operational definition for each morbidity objective.
ICD-9-CM is a clinical modification of the WHO’s International Classification of Diseases, 9th Revision (ICD-9). The term “clinical” is used to emphasize the modification’s intent to serve as a useful tool in the area of classification of morbidity data for indexing of hospital medical records, medical care review, and ambulatory and other medical care programs, as well as for basic health statistics. ICD-9-CM provides greater specificity at the fifth digit level of detail, which goes beyond the three and four digit level of ICD-9.
ICD-9-CM is used to code and classify morbidity data from inpatient and outpatient records, physicians’ offices, long term care facilities and most health surveys. ICD-9-CM is compatible with its parent classification (ICD-9), thus meeting the need for comparability of morbidity and mortality statistics.
Additional codes and code changes were made to the ICD-9-CM beginning in 1986. A conversion table for diagnosis and procedure code changes between 1986 and 1998 is available to assist users in data retrieval. The table shows the date the new code became effective and its previously assigned code equivalent. The latest additions to the classification appear in bold print. The conversion table may be found on the NCHS Web site at the following address:
http://www.cdc.gov/nchs/datawh/ftpserv/ftpicd9/ftpicd9.htm#conv
Code assignment using ICD-9-CM is based on official national coding guidelines. The guidelines for selecting the “first-listed” or principal diagnosis for morbidity records differ from those used in coding death records to select the underlying cause of death. Under morbidity coding rules, the first listed or principal diagnosis is that condition established after study to be chiefly responsible for occasioning the admission to the hospital or the encounter with the health care provider for care. In some instances the principal diagnosis may be a manifestation of the disease rather than the underlying cause. For example, if a patient with a primary malignant neoplasm with metastasis is admitted to receive treatment directed toward a secondary site, the secondary site would be designated on the hospital discharge form as the principal diagnosis.
For Healthy People 2010, the principal (“first-listed”) diagnosis is generally used to track the morbidity objectives. However, in some cases “all-listed” diagnoses, which include the principal and all other diagnoses appearing on the medical record, are used (as many as 7 to 10 diagnoses may appear in some records). Details on the specific ICD-9-CM diagnoses used are noted in the operational definition for each applicable objective and are summarized in Appendix E.
The official coding guidelines are available on the NCHS morbidity Web site at the following address:
http://www.cdc.gov/nchs/datawh/ftpserv/ftpicd9/ftpicd9.htm#guide
A clinical modification of ICD-10 (ICD-10-CM) has been developed as a replacement for ICD-9-CM, however, as of this writing, an implementation date had not been designated. Once implemented, revised coding guidelines, training materials and crosswalks between ICD-9-CM and ICD-10-CM will be made available on the NCHS Web site.
Data for theHealthy People 2000morbidityobjectives from the sources listed above were also coded according to ICD-9-CM, although in a few cases, the specific codes used for the 2010 objectives are different from those used for the comparable Healthy People 2000objective. These differences are noted in the operational definition for the objective in Part B: Operational Definitions.
1. World Health Organization (WHO). Manual of the International Statistical Classification of Diseases, Injuries, and Causes of Death, Based on the Recommendations of the Ninth Revision Conference. Geneva, Switzerland: WHO, 1977.
2. WHO. International Statistical Classification of Diseases and Related Health Problems, Tenth Revision. Geneva, Switzerland: WHO, 1992.
3. Hoyert, D.L.; Kochanek, K.D.; and Murphy, S.L. Deaths: Final Data for 1997.National Vital Statistics Reports. Vol. 47 No.19, figure 4. Hyattsville, MD: National Center for Health Statistics (NCHS), 1999.
4. NCHS. Vital Statistics, ICD-10 Cause-of-Death Lists for Tabulating Mortality Statistics, Effective 1999.NCHS Instruction Manual, Part 9. Hyattsville, MD: Public Health Service (PHS), NCHS. 1997.
5. NCHS. Vital Statistics of the United States, Vol. II, Mortality, Part A, Technical Appendix. Washington, DC: U.S. Department of Health and Human Services (HHS), PHS, annual.
6. HHS. International Classification of Diseases, Ninth Revision, Clinical Modifications. 6th ed. Washington, DC: HHS Publication No. 96-1260. Washington, DC: HHS, PHS, Health Care Financing Administration, 1997.
Data used to track the Healthy People 2010 objectives are based on events occurring in the 50 States and the District of Columbia, where available. Unless specifically noted, all objectives exclude data for U.S. territories. The data used to track most population-based Healthy People 2010objectives are derived from either a national census of events (for example, National Vital Statistics System, National Notifiable Disease Surveillance System, Fatality Analysis Reporting System) or from nationally representative sample surveys (for example, National Health Interview Survey, National Household Survey on Drug Abuse, School Health Policies and Programs Study).
For some objectives, however, complete national data are not available and data for selected States and/or areas are used to monitor the objectives. In these cases, the coverage area is described with the data for the objective and in the operational definitions. Examples of these data systems include the Metropolitan Atlanta Developmental Disabilities Surveillance Program (MADDSP), the Adult Spectrum of Disease Project (ASD), the Health Care Cost and Utilization Project (HCUP), and the Toxic Exposure Surveillance System (TESS). Data for these objectives may not be representative of the United States as a whole. If during the decade national data become available, they will be used to track the objectives.
For some national data systems that cover the entire United States, such as the Behavioral Risk Factor Surveillance System and the National Vital Statistics System, data are not available for some variables for all States. This is either because data for a specific variable are not collected by some States or because the quality of data for some States is not sufficient to produce reliable estimates for some variables. Some examples are shown in Table 6, with the number of States reporting in the baseline data year. The number of reporting States can vary from year to year. This information is also shown in the operational definitions for selected objectives.
Table 6. Variables in major data systems for which data are not available from all States. |
||
|
Data System |
Variable |
Number of States With Data Available |
|
National Vital Statistics System (Mortality) |
Education |
46 States + District of Columbia (1998) |
|
National Vital Statistics System (Natality) |
Maternal smoking |
46 States + District of Columbia and New York City (1998) |
|
Behavioral Risk Factor Surveillance System |
Diabetes variables |
39 States (1998) |
|
Behavioral Risk Factor Surveillance System |
Disability |
11 States + District of Columbia (1998) |
Healthy People has provided a framework for national, State, and local health agencies and non-governmental organizations to assess health status, health behaviors, and services and to plan and evaluate health promotion programs.1, 2 The national Healthy People initiatives have served as a “menu” for identifying State and local priorities and selecting objectives that are most relevant to specific States, communities, and specific settings (schools, worksites, etc.), and health care delivery systems.3, 4 By using the national Healthy People initiative as a common point of departure, agencies and organizations have tailored programs targeted toward their customers, yet retained a common basis for evaluating performance in relation to both the nation, other States, or populations.5
This focus on performance has prompted State and local health agencies to shift from their emphasis of primarily providing services to one that conducts needs assessment and quality assurance.6, 7 This shift has required increased collection and analysis of data. Health care delivery organizations have also experienced this shift and have increased efforts to collect standardized data on patients, services, and outcomes.8 The increased emphasis on data collection and analysis for purposes of assessment and evaluation has increased the need to address the associated issues of data availability, validity/reliability, comparability, and utilization. These issues also affect the relevance of the national Healthy People objectives at the State and local level. The large number and diversity of State and local health agency structures and resources amplify the impact of these data issues when trying to compare Healthy People plans, objectives, and progress among States or between a State and the nation. States also vary considerably in their capacity to monitor the objectives they identify as most relevant to their constituents.9 Some key areas where these issues need to be examined at State and local levels are discussed below.
The Healthy People “menu” provides a useful way for States and localities to focus on serious health issues, but many agencies and organizations have tailored the objectives to better focus on specific concerns of their constituents. These modifications may more effectively address the health concerns of the State or local population, but they also reduce comparability when evaluating objective progress relative to the nation, other States, or localities.10
Many Healthy People objectives are population based and are expressed in terms of mortality or morbidity rates (for example, lung cancer deaths per 100,000), where the denominator is a population estimate. National, State, and local health agencies primarily rely on population estimates produced by the U.S. Census Bureau. The Bureau produces estimates for the nation, States, counties, and large municipalities during the decennial census and has provided annual post-censal estimates since 1990 (see section 3: Population Estimates). These estimates are provided by gender, age, and race and ethnicity (see section 4: Population Template). However, the sizes of some racial groups (American Indian or Alaska Native and Asian or Pacific Islander) are relatively small, even at the national level, and are distributed unevenly across State and local areas. This precludes many jurisdictions from producing reliable rates for objectives that focus on these populations.
Some Healthy People objectives (for example, suicide or HIV deaths) address important, sensitive health issues which are, fortunately, relatively rare events. Reporting small numbers of suicides or HIV deaths in a county or municipality with a small population may produce unreliable, nonrepresentative rates. Reporting these rates by certain characteristics, including geocoding and displaying maps of the distribution of sensitive or rate events, also may jeopardize confidentiality. It may be necessary to aggregate data over geographic areas, personal characteristics, and/or data years to address both of these problems.
In general, States and localities age-adjust mortality data to the same standard population used for the national data (see section 5: Age Adjustment). However, because Healthy People 2010 is implementing the 2000 standard population ahead of the recommended schedule (see section 5, Age Adjustment), there may be a period of time when the State mortality data do not match the Healthy People 2010 data.
The availability and comparability of data for national, State, and local monitoring of Healthy People objectives vary considerably. Some data, especially vital statistics, are readily available at national, State, county, and some municipal levels. The standardization of vital statistics data contributes to its comparability across jurisdictions. Because they are readily accessible and generally comparable, mortality and natality data were key parts of the 18 Health Status Indicators (HSI) selected for widespread State and local use in Healthy People 2000.11 However, vital statistics data provide only a limited perspective on health status, risk behaviors, and access to health care. Morbidity and risk factor data are required to monitor a very large proportion of the current and proposed Healthy People objectives. Data for these objectives come from a wide range of household surveys, environmental hazard data, and other sources.
Many of the national Healthy People objectives are monitored using data from the National Health Interview Survey (NHIS). Some of these objectives are monitored at State and some local levels using data from the Behavioral Risk Factor Surveillance System (BRFSS). Details of these surveys (for example, design, sampling) are described in Part C: Major Data Sources. In general, however, it should be noted that both differences in the data collection methods (household interview versus telephone interview) and wording of questions used to monitor the same objectives can affect the comparability of the information collected. Additionally, some objectives monitored with identical questions in both the NHIS and the BRFSS (for example, firearm storage) are only included periodically in a specific rotating module of the BRFSS or supplements to the NHIS. Not all States use these modules or the year of the “rotation” may not coincide with national data from the NHIS. This limits comparability between national and State data.
Other national Healthy People objectives are monitored using composite data sources (for example, General Estimates System, National Water Quality Trends Report). The national data from these systems are aggregated from data collected at State or local levels. Unlike the vital statistics data (which include all births and deaths), several of these systems are samples of events that use somewhat different data collection and analysis methods between States or between communities.12 This affects the quality and comparability of national, State, and local data.
For other Healthy People objectives, State and local jurisdictions were unable to monitor progress. This prompted the development of Priority Data Needs under Healthy People 2000,13 which identified sources of State and local data that could be used to track important health issues, such as adult immunization and access to primary health care. During the development of the Healthy People 2010 objectives, participants proposed that a set of Leading Health Indicators be selected to further improve national, State, and local agencies’ abilities to measure and evaluate health status and programmatic activity.14 The availability of data for the Leading Health Indicators may be somewhat limited at the State level and it represents a substantial challenge for measurement at the local level.
1. Public Health Foundation. Measuring Health Objectives and Indicators: 1997 State and Local Capacity Survey. Washington, DC: the Foundation, 1998.
2. American Public Health Association. Healthy Communities: Guidelines for Community Attainment of the Year 2000 National Health Objectives. Washington, DC: the Association, 1991.
3. Public Health Service (PHS). Promoting Health/Preventing Disease: Objectives for the Nation, Washington, DC: U.S. Department of Health and Human Services (HHS), 1980.
4. HHS. Healthy People 2000: National Health Promotion and Disease Prevention Objectives. Washington, DC: HHS, PHS, 1991.
5. Twenty-two percent of the objectives included in the HHS agency’s strategic plan (developed in accordance with the Government Performance and Results Act of 1993) were adopted from Healthy People 2000 (see Office of Disease Prevention and Health Promotion. HHS Leading Indicators for Healthy People 2010: A report from the HHS Working Group on Sentinel Objectives. Washington, DC: HHS, 1998).
6. Institute of Medicine. The Future of Public Health. Washington, DC: National Academy Press, 1988.
7. National Center for Health Statistics (NCHS), Centers for Disease Control and Prevention. The CDC Assessment Initiative: A Summary of State Activities. Statistics and Surveillance Note, No. 7. Hyattsville, MD: NCHS, 1995.
8. Many health care organizations have adopted the use of the Health Employer Data Information System (HEDIS) as a mechanism to standardize the collection of data and to evaluate outcomes. (See National Committee for Quality Assurance Web site: <http://www.ncqa.org>.)
9. The Public Health Foundation reports that in 1997, States reported an average ability to measure 39 percent of the Healthy People 2000 objectives. (See Public Health Foundation. Measuring Health Objectives and Indicators: 1997 State and Local Capacity Survey, Washington, DC: the Foundation, 1998.) To focus on the need to develop capacity for tracking at the State and local level, Healthy People 2010 includes a separate focus area aimed at improving infrastructure and surveillance capability. (See Office of Public Health and Science. Healthy People 2010: Objectives for Improving Health. Washington, DC: HHS, 1998.)
10. For example, there is a national objective calling for increased testing and mitigation of homes for threats from radon. Some States have adopted this objective verbatim, whereas others also have included schools or day care centers within the same objective related to home testing. Additionally, the operational definitions used for the same or similar national and State/local objectives may vary considerably. The national radon objective is monitored using self-report data from a household survey, whereas some States use data based on actual installation of radon monitors and picocurie information collected.
11. Freedman, M.A. Health Status Indicators for the Year 2000.Statistical Note No. 1. Hyattsville, MD: NCHS, 1991.
12. For example, the National Water Quality data are compiled from State data on “assessed” rivers, lakes, and estuaries. States vary in the proportions and the specific bodies of waters they assess across time. Hence, both State and national estimates may be subject to considerable variation.
13. Kim, I., and Keppel, K.K. Priority Data Needs: Sources of National, State, and Local-Level Data and Data Collection Systems. Statistical Note No.15. Hyattsville, MD: NCHS, 1997.
14. HHS. Healthy People 2010: Understanding and Improving Health. 2nd ed. Washington, DC: U.S. Government Printing Office, November 2000.
For many health outcomes, assessing all individuals in a population may be impossible, impractical, expensive, or inaccurate. Therefore, it is usually advantageous to study a sample of the original population.1 Much of the data used to monitor the Healthy People 2010 objectives are derived from sample surveys (for example, National Health Interview Survey, National Survey of Family Growth, National Household Survey on Drug Abuse, National Health and Nutrition Examination Survey, Youth Risk Behavior Surveillance System) that make estimates for a population from a representative sample of respondents. These estimates are subject to sampling variation or sampling error. The standard error is a measure of sampling error and represents the variations that can occur by chance since only a sample of the population is surveyed rather than the entire population. Assuming a normal distribution of events, the chances are about 68 in 100 that an estimate from the sample would differ from a complete census by less than the standard error. The chances are about 95 in 100 that the difference would be less than twice the standard error. This is often referred to as the 95 percent confidence interval, where the estimate is expressed as a range of the observed rates, approximately +/- 1.96 standard errors.
Some of the data (for example, vital statistics, infectious disease incidence) used to track the Healthy People 2010 objectives are based on complete counts. As such, they are not subject to sampling error, although they are subject to errors in the registration process. However, when the estimates are used for analytical purposes, such as the comparison of rates over a period of time or for different groups or areas, the number of events that actually occurred may be considered as one of a large series of possible results that could have arisen under the same circumstances. This is generally known as random variation. When the number of events is large, random variation is usually small. However, when the number of events is small (fewer than 100) and the probability of such an event is small, random variation can be substantial and considerable caution must be used in interpreting the change described by the estimates. In these cases, it is desirable to compute the standard error of the estimates and use that computation in the comparison of interest. More information on random variation and small numbers can be found in the Vital Statistics of the United States.2
To properly interpret differences between rates for different groups or changes over time derived from sample surveys, it is important to consider the sampling variation associated with each rate. Healthy People 2010 specifies the use of a population template that includes detailed racial, ethnic, and socioeconomic breakouts for all population-based objectives (see section 4: Population Template). Therefore, some objectives show data for relatively small populations groups. These data may be associated with large standard errors and, therefore, apparent differences between population groups or between a population group in the template and the total population may be within expected sampling or random error. Standard errors should be considered when evaluating progress or comparing population groups for objectives using survey data. For ease of presentation, the standard errors associated with the estimates for the Healthy People 2010 objectives do not appear in either Healthy People 20103or Tracking Healthy People 2010. However, where available, they will be included in the Healthy People 2010 database (see section 10: Healthy People 2010 Database). More information on the sample design and variance estimation for some of the major data systems used to monitor the Healthy People 2010 objectives can be found in Part C: Major Data Systems and in other publications.4, 5, 6, 7, 8, 9, 10, 11, 12, 13
If the data for any group are considered statistically unreliable, “DSU” (data are statistically unreliable) is shown in the cell in place of the data in Healthy People 20103and in the Healthy People 2010 database (see section 10, Healthy People 2010 Database). DSU is used to address a number of situations that produce unreliable data that vary by data system. For a number of Healthy People 2010 sample survey data systems (for example, NHIS and NHANES), a figure is considered unreliable if it has a relative standard error (RSE) of greater than 30 percent. For vital statistics data that are based on complete counts, a figure is considered unreliable if it is based on fewer than 20 events. Data may also be considered unreliable if there are a large number of unknown entries or if the sampling frame cannot produce representative estimates for a particular group.
For most objectives, the data are for single years. However, for some objectives (or subgroups in the population template) that are based on relatively few events, multiple years of data are used to produce more stable estimates.
1. Kuzma, J.W. Basic Statistics for the Health Sciences. Loma Linda University, CA: Mayfield Publishing Co., 1984.
2. National Center for Health Statistics (NCHS). Vital Statistics of the United States. Vol. I, Natality and Vol. II, Mortality. Washington, DC: Public Health Service (PHS), annual.
3. U.S. Department of Health and Human Services (HHS).Healthy People 2010. 2nd ed. With Understanding and Improving Health and Objectives for Improving Health. 2 vols. Washington, DC: U.S. Government Printing Office, November 2000.
4. Maurer, K.R. Plan and operation of the Hispanic Health and Nutrition Examination Survey, 1982–84. Vital and Health Statistics1(19), 1985.
5. NCHS. Plan and operation of the Third National Health and Nutrition Examination Survey, 1988–94. Vital and Health Statistics1(32), 1994.
6. Ezzati, T.M. Sample design: Third National Health and Nutrition Examination Survey. Vital and Health Statistics 2(113), 1992.
7. Waksberg, J.; Sperry, S.; Judkins, D.; and Smith, V. National Survey of Family Growth, Cycle IV, Evaluation of linked design. Vital and Health Statistics 2(117), 1993.
8. Judkins, D.R.; Mosher, W.D.; and Botman, S. National Survey of Family Growth: Design, estimation, and inference.Vital and Health Statistics2(109), 1991.
9. Massey, J.T.; Moore, T.F.; Parsons, V.L.; et al. Design and estimation for the National Health Interview Survey, 1985–94. Vital and Health Statistics2(110), 1989.
10. Kann, L.; Kolbe, L.J.; and Collins, J.L.; eds. Measuring the health behavior of adolescents: The Youth Risk Behavior Surveillance System and recent reports on high-risk adolescents. Public Health Reports 108(Suppl. 1):1-67, 1993.
11. Errecart, M.T.; Ross, J.G.; and Robb, W.; et al. The School Health Policies and Programs Study (SHPPS): Methodology. Journal of School Health 8(65):295-301, 1995.
12. Benson, V., and Marano, M.A.. Current estimates from the National Health Interview Survey, 1995. Vital and Health Statistics10(199), 1996.
13. Haupt, B.J., and Kozak, L.J. Estimates from two survey designs: National Hospital Discharge Survey. Vital and Health Statistics13(111), 1992.
The Healthy People 2010 database, called “DATA2010,” can be accessed through the CDC/WONDER system found on the Internet at http://wonder.cdc.gov/data2010 or through the NCHS Web site at http://www.cdc.gov/nchs. Through DATA2010 the user can create tables that contain the baseline and tracking data for each of the Healthy People 2010 objectives and the Leading Health Indicators.
Tables can be constructed by selecting an entire Healthy People 2010 focus area (with or without related objectives in other focus areas), by selecting an objective within a focus area, or by selecting an objective from a keyword search that will search for all objectives containing a specific word or phrase. Users can also select all data for population subgroups such as race, ethnicity, gender, SES status, etc. Once tables are generated they can be exported in either ASCII, comma-delimited, or HTML format for use in common software applications such as Lotus 1-2-3 and SAS.
These Web sites also allow users to obtain other Healthy People 2010 information, such as full text of the objectives, lead agency contacts for each focus area, and information on Healthy People 2010 progress reviews.
DATA2010 is a SAS database that contains one record (or observation) for each objective and subpart found in the 28 focus areas. The database will also contain records for the measures used to track the goals and the Leading Health Indicators.
Each record in the database contains the following information:
n |
Objective number |
|
n |
Objective text (abbreviated) |
|
n |
Baseline year |
|
n |
Baseline data |
|
n |
Tracking data for subsequent years (future) |
|
n |
2010 Target |
|
n |
Comments (definitions, clarifications, and explanations) |
|
n |
Data source(s) |
In the future, DATA2010 will contain additional population groups, and include options for chart and map generation. State data are expected to be added to the database, and users will be able to select national and/or State data. There also will be links to the operational definitions in Tracking Healthy People 2010 and to the Healthy People 2010 Web site http://health.gov/healthypeople/. Where available, standard errors of the estimates will be included in the database