|
||
|
|
||
 | |||
|
|||
As you read this, millions of people worldwide are in desperate need
of a source of fuel for cooking their food. Millions of people live in
homes that do not have electric lights, much less appliances that
improve the quality of life in all those countless ways that we, in
developed countries, take for granted. There are health clinics in
tropical countries around the world that are at risk of ruining badly
needed medicines because they cannot keep them adequately refrigerated.
Surfing closer to home, if you are reading this in California, your
computer may flick off without warning as rolling blackouts deprive
portions of the state of power, seemingly at random. |
For more information about NASA's Surface Meteorology and Solar Energy Project, visit the home page (a new browser window will open). | ||
The issue in most of these cases is not too little power. Rather,
the issue is we humans don’t effectively and efficiently make use
of the power resources—all of the resources—available to us. We in the
western world are accustomed to thinking in terms of building more power
plants so we can burn more coal and fossil fuels to feed our insatiable
demand for power. But we must also aggressively explore how to better
take advantage of those sources of energy that nature gives us freely,
and replenishes constantly. The sunlight that reaches the Earth every
hour is greater than the amount of energy used by the Earth’s
entire population in a year. There are many regions in our world that
receive at least 4 kilowatt hours of sunlight per square meter per day.
This energy could be used to, say, bake a chicken or boil a stew. You
could even power most of your home, except for heating and air
conditioning! |
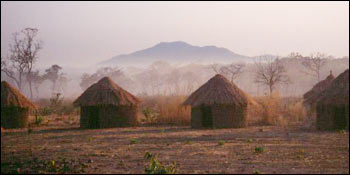
In much of the world there is no elecricity, no deliveries of home heating oil, and no natural gas piped into the home. These regions are dependent on fuels such as wood and animal dung for home heating and cooking. Such fuels are dirty and inefficient, and often in short supply. Alternative energy sources such as solar power and wind energy can provide necessary energy, but they need to be placed in appropriate areas with enough sun and wind. (Photograph copyright Martin Beland) | ||
Many people who live in underdeveloped countries spend more of their disposable income on fuel for cooking food than they have to spend on food itself. Most of these are tropical countries where, ironically, there is ample sunlight to power many of the people’s basic needs. In certain areas, there is often an abundance of wind energy. Turbines can easily capture enough of this wind energy to, say, power light bulbs or charge batteries. What is lacking is the technology—at an affordable price for those
who need it most—for people to tap into these and other sources of
natural renewable energy. Before engineers can develop such technology,
they need to know how much of a given type of energy is available, and
precisely when and where. Specifically, for any given locale, engineers
need accurate data collected over a long period of time. Any system for
harnessing a natural renewable energy resource must be adapted for the
location where the technology is to be used. |
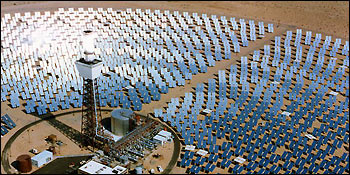
Arid areas with few cloudy days are ideal locations for solar power, as long as they aren’t too far north or south (if you want electricity in the winter, at least). This experimental solar power station in California’s Mojave Desert uses light reflected by mirrors to heat molten salt to 565°C (1050°F). The salt then boils water which drives a steam turbine to generate electricity. Other solar power technologies are smaller and more distributed, such as photovoltaic solar cells and even low-tech solar ovens. (Photograph courtesy National Renewable Energy Laboratory) | ||
Thanks to the initiative of a team of scientists at NASA’s Langley Research Center (LaRC), engineers and amateur inventors worldwide now have free access to global-scale data on insolation (or incoming sunlight), wind speed and direction, and a range of meteorological variables. Moreover, the LaRC team translated these data into an easy-to-use format so that they plug seamlessly into a new generation of software tools that engineers use to design energy-efficient systems. Already, private companies are using these NASA data to design, build, and market new systems for harnessing renewable energy resources. But the best part is that these new systems will be marketed at affordable prices in underdeveloped countries for those who need them most. The data used in this study are available in one or more of NASA's Earth Science Data Centers. |
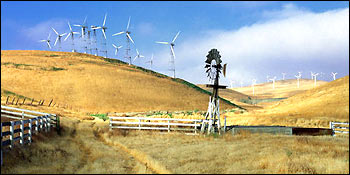
Wind power is another type of alternative energy suitable for undeveloped areas. State-of-the-art wind turbines can generate electricity; or windmills can perform simple tasks like pumping water. (Photograph courtesy National Renewable Energy Laboratory) |
Global Data for Global Concerns |
|||
In 1986, there was international competition among various agencies to produce the first accurate estimate of the amount of sunlight received at the surface over the entire globe. Robert Schiffer, NASA’s representative to the World Climate Research Program, asked NASA LaRC to put together the first such data set using Surface Radiation Budget satellite data. It was Schiffer’s initiative that ultimately set the stage for NASA’s currently ongoing Earth Science Enterprise Surface Radiation Budget Program. The initiative succeeded and a new global insolation data set was produced and stored in the LaRC data archive. Fast forward to 1996 when the U.S. Department of Energy (DoE) approached NASA with the idea of publishing some of its global-scale data in a format that is easily accessible and usable by the general public, particularly private industries. At that time there were no publicly accessible global data sets on key parameters like surface insolation. Measurements were made at only a thousand or so highly localized sites around the world, mostly clustered in Europe—too few and far between to serve the DoE’s goal. Their goal was to stimulate greater commercial development of innovative new technologies for harvesting natural renewable energy sources worldwide. NASA responded to the DoE need and the NASA Surface Meteorology and
Solar Energy (SSE) Project was born. The initial focus was on
publishing the same Surface Radiation Budget data that scientists were
using to construct and refine global climate models. The SSE Project
painstakingly synthesized previously released data sets from NOAA’s
Advanced Very High Resolution Radiometers (AVHRR) and Geostationary
Operational Environmental Satellites (GOES), the Japanese Geostationary
Meteorolgical Satellites, and European Meteorological Satellites
(Meteosats). These regional satellite data sets are contained in the
International Satellite Cloud and Climatology Project (ISCCP) and the
Goddard Earth Observing System General Circulation Model global
data sets. The team then synthesized the global data sets—containing a
variety of measurements, ranging from cloud cover to solar insolation to
meteorological variables, such as temperature, wind speed, and
atmospheric pressure—into the SSE data set. |
|||
“We could offer global-scale measurements of satellite-derived renewable energy resource data, whereas private industry previously only had access to ground measurement data,” states Charles Whitlock, SSE Project Engineer. “Although there are more than a thousand ground monitoring stations around the world which have measurements of insolation, historically there has been very little effort to cross calibrate the equipment at these sites to ensure the measurements are consistent. And, only a fraction of the stations collected data routinely.” Right on schedule, the SSE Team published the first version of its SSE Web Site (at http://eosweb.larc.nasa.gov/sse/), and within weeks the team started receiving feedback, complaints mostly, from commercial users. Users complained that the scientific terminology on the site was confusing. Then, there were issues with data format and units of measure that commercial engineers weren’t used to. “Engineers in commercial industry rarely use scientific data as presented,” Whitlock explains. “They work with averages, maximums, minimums, specific events, funny accumulations, and ‘degree days.’” (A degree-day is a measure of the difference between a given standard and a given day’s average temperature. Degree-days in the summer usually refer to the number of degrees by which the mean temperature exceeds 65�F, or 18�C.) Whitlock adds that there is also a perceived element of risk on the part of commercial companies in working with NASA climate data. “Generally, the commercial industry is reluctant to use NASA data because they don’t have a history with it. It is often an unknown quantity to engineering companies, their insurance companies, and their financiers.” So, the SSE Team went to work on Version 2 of its Web site. The first step was to learn the language spoken by businesses. To help them, the SSE Team established partnerships with several small commercial companies and non-profit organizations, such as the Center for Renewable Energy and Sustainable Technology. Gradually, the SSE Team developed rapport with their new partners and learned to speak their language. The team gained a better understanding of the types of measurements their commercial partners are accustomed to working with and began to synthesize the NASA data into familiar formats for them. Twenty-four months later, the SSE Team published Version 2 of its Web site with basically the same information, but the terminology and data parameters were much improved from the users’ perspective. Consequently, the new release was much more successful. “We learned you have to market your product,” Whitlock states, “and you have to understand the culture of the businesses you interact with.” But what won over even the most skeptical of clients, he says, was the SSE Team’s demonstrations that the satellite data compared quite closely with the 30-year averages compiled by the localized measuring stations that the commercial industry typically used. Now commercial users were ready to trust the satellite data. “Our role is to provide measurements of the solar energy that is heating the Earth,” concludes Whitlock. “We’re giving commercial users the best possible data that they can get their hands on today. And we’re providing global coverage, which is important for those who work in remote locations.” |
Global maps of average wind speed help engineers and amateur inventors determine how best to develop new systems for harvesting wind energy. These new systems are tailor made for particular locations. Click once on the animation to stop it; click twice to resume play. (Animation courtesy SSE Project) |
How to Build a Better Light Trap |
|||
Software developers are taking advantage of the NASA data sets by writing new programs for computer-aided design of advanced new systems for converting sunlight into electricity. SolarSizer is a good example of one such software tool. Programmed by Eric Woods and Ken Olson, SolarSizer enables engineers to download NASA data so that they may take all the geographic and meteorological characteristics of a given region into account as they design systems for use in that region. With SolarSizer, engineers can design a new solar energy system and then use real satellite data to simulate the environment in which their new system must operate to see how well it will perform. This is a capability not present in most photovoltaic design programs used commercially, says Woods, co-owner of Sunnywood Designs. “The promise of the new NASA database is that we can go anywhere
in the world and get solar radiation data from satellites,” states
Olson, founder and owner of his own company called SolEnergy. “Our
software makes it possible to go to the NASA SSE Web site and extract
data from the database—for a certain location—and use them in our
program.” |
|||
 |
“SolarSizer provides a graphical method for designing a photovoltaic system that users can do through a drag-and-drop kind of interface,” Woods adds. “The tool gives users the ability to look at the accuracy of the satellite data. There are characteristics of every geographic location that can impact the accuracy of the data—things like terrain, typical snow and ice coverage, and cloud coverage—so designers can judge for themselves the quality of the data for a particular location.” Olson works primarily in Nicaragua and Honduras. “In those countries there is much variation in topography and micro-climates, so I have to be careful to use the best available data for a particular location,” he says. A solar energy system designer’s interest is in knowing the amount of solar energy—measured in kilowatt hours per square meter per day—that reaches the Earth’s surface. Among other functions, their program can then calculate how much solar energy is received by surfaces that are tilted at specific angles. According to Olson, some panels are fixed so that they may tilt at one of three possible angles, whereas there are more sophisticated systems that actually track the position of the sun through the day to constantly maintain an optimum tilt angle. |
The graph to the left shows average solar insolation for each month of the year for cities on four different continents. Timbuktu, in the Sahara desert, receives abundant solar energy year round. Seattle, on the other hand, receives roughly 6 kilowatt hours per square meter per day in mid-summer, but very little in the winter. The solar energy bathing Bangkok and Brasilia, tropical cities just north and south of the equator, varies more due to cloud cover than season. By combining this type of satellite data with local data, planners can take into account microclimate and topography to precisely design and position systems to harvest solar power. (Graph by Robert Simmon, based on data from the SSE Project) | |
“We’re designing solar energy systems that maximize the amount of sunlight we collect over the course of the year,” Olson explains. “To do that, you must tilt solar panels toward the south and then back toward horizontal as a function of latitude. So, using geometry, we can accurately calculate how much energy we will get from our solar panels as a function of tilt angle.” The SolarSizer tool also facilitates the design of more advanced materials for making photovoltaic systems. There is a cost versus efficiency tradeoff that designers must take into consideration. Crystalline silicon technologies are the most efficient for converting sunlight into energy, catching and converting up to 16 percent of the sun’s rays that reach the solar panel, according to Olson. Yet, other commercially available panels are made with amorphous silicon, which has on the order of 6 to 8 percent efficiency. But because the amorphous silicon material is cheaper, Olson says it will likely be the more commonly used material in the future. “In designing the next generation solar energy systems, satellite data are the very best we could hope for,” Olson concludes. “The importance of having those data grows as commercial investment in those systems grows.” |
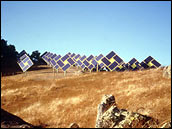 These “sunflowers” (panels of photovoltaic solar cells) tilt to track the sun during the course of a day. This maximizes their efficiency. (Photograph courtesy National Renewable Energy Laboratory) |
Baking in the Sun |
|||
“It is as unnecessary to use combustibles for fuel under a
brilliant sun as it is foolish to put a solar oven out in the
rain,” states Darwin Curtis, a partner in Solar Household Energy,
Inc. (SHE). “Yet in many tropical areas of the world, more than 40
percent of families’ disposable income is spent on fuel for
cooking. Sometimes more is spent on fuel than on food.” |
|||
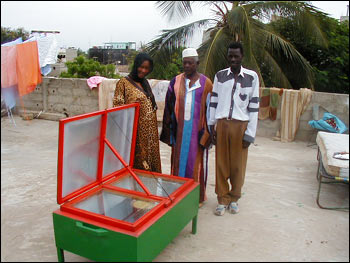
Several years ago Curtis and his colleagues recognized that the distribution of solar ovens in underdeveloped countries was not going well. (As the term suggests, a solar oven is a cooking device powered solely by sunlight.) At that time, Curtis explains, the entire effort to make solar ovens available to developing nations—parts of the world where this technology is needed desperately—was in the hands of governments, non-government organizations (NGOs), and the United Nations. “The problem was much too large to be dealt with by charitable organizations,” says Curtis. “The only way adequately to address the problem is to induce private enterprise to get involved.” Thus, Curtis and his colleagues founded SHE to support developing world entrepreneurs in the manufacture and merchandising of solar cooking equipment. Curtis says the first hurdle is to get people to accept this radically different technology. They must overcome the perception that solar ovens are too inefficient for people who are accustomed to more conventional means of cooking, and too expensive for those people who have little or no disposable income. People have generally regarded affordable solar ovens as unacceptable, and acceptable ovens as unaffordable, he summarizes. With this understanding, SHE began a research and development initiative to construct a new solar oven of maximum commercial viability. Their goal is to have a prototype by early 2002. Curtis knows that in order for this model to succeed, it must meet four criteria: higher efficiency, durability, minimal cost, and attractive appearance. (If it doesn’t look right, it won’t sell.) “Our objective is to increase by 50 percent the efficiency over comparable ovens,” Curtis explains. “The most widely affordable solar ovens now in use cost $2 or $3. They are remarkably effective but they are made of cardboard. We must use materials that can last a decade or more. And the ovens must retail for less than $30.” Curtis says NASA satellite data are helping SHE determine which parts
of the world receive sufficient sunlight to promote solar cooking. He
reckons that SHE should focus on places that receive at least 4 kilowatt
hours per square meter per day on average. Luckily, he says, the areas
of the world where many people in greatest need for this technology live
have solar insolation above 4, and as high as 6 kilowatt hours per
square meter per day. |
Solar ovens are a simple and effective way to provide the energy needed for cooking to people without access to other energy sources. The ovens concentrate solar energy by reflecting sunlight through a transparent layer such as glass or plastic and onto a dark cooking pot. The sunlight is converted to heat on the dark surface of the pot, and the heat is trapped by the transparent material. Some solar ovens reach temperatures as high as 350° F (177° C), which is why you don’t want a car with black seats. (Photograph courtesy SSE project) | ||
So how do solar ovens work? The concept depends upon two things: a means of converting solar energy into heat, and a means of trapping this heat around a cooking vessel. Curtis explains this is done most simply by using a black or dark-colored vessel surrounded by some sort of transparent envelope. Sunlight passes through the transparent envelope and strikes the dark pot, which absorbs the sunlight and converts it into heat. The transparent envelope traps the heat to achieve cooking temperatures. “This is often referred to in literature, as ‘the greenhouse effect,’” Curtis says. “In cheap solar ovens, 250�F (121�C) can be achieved. In the expensive models, 350�F (177�C) is not unusual.” He points to a 1997 United Nation’s Food and Agriculture Organization report that states there are 2 billion people in the world who are experiencing shortages of fuel to cook with. Curtis acknowledges that solar ovens are not a comprehensive solution for all of these people because there are days when the sun doesn’t shine. But he points out that in many places there are well over 300 days of sunshine in a year. The use of solar ovens in these circumstances can reduce dramatically the need for other fuels and can therefore help improve the quality of life. |
Many of the regions most in need of energy, such as West Africa and the highlands of South America, receive an abundance of sunlight. The animation at left shows the average amount of sunlight a given area of the Earth receives each month. Four kilowatt hours per square meter per day of solar energy is enough to meet most basic energy requirements. Click once on the animation to stop it; double-click to resume play. (Animation courtesy SSE Project) |
| |||
|
|||
As you read this, millions of people worldwide are in desperate need
of a source of fuel for cooking their food. Millions of people live in
homes that do not have electric lights, much less appliances that
improve the quality of life in all those countless ways that we, in
developed countries, take for granted. There are health clinics in
tropical countries around the world that are at risk of ruining badly
needed medicines because they cannot keep them adequately refrigerated.
Surfing closer to home, if you are reading this in California, your
computer may flick off without warning as rolling blackouts deprive
portions of the state of power, seemingly at random. |
For more information about NASA's Surface Meteorology and Solar Energy Project, visit the home page (a new browser window will open). | ||
The issue in most of these cases is not too little power. Rather,
the issue is we humans don’t effectively and efficiently make use
of the power resources—all of the resources—available to us. We in the
western world are accustomed to thinking in terms of building more power
plants so we can burn more coal and fossil fuels to feed our insatiable
demand for power. But we must also aggressively explore how to better
take advantage of those sources of energy that nature gives us freely,
and replenishes constantly. The sunlight that reaches the Earth every
hour is greater than the amount of energy used by the Earth’s
entire population in a year. There are many regions in our world that
receive at least 4 kilowatt hours of sunlight per square meter per day.
This energy could be used to, say, bake a chicken or boil a stew. You
could even power most of your home, except for heating and air
conditioning! |
In much of the world there is no elecricity, no deliveries of home heating oil, and no natural gas piped into the home. These regions are dependent on fuels such as wood and animal dung for home heating and cooking. Such fuels are dirty and inefficient, and often in short supply. Alternative energy sources such as solar power and wind energy can provide necessary energy, but they need to be placed in appropriate areas with enough sun and wind. (Photograph copyright Martin Beland) | ||
Many people who live in underdeveloped countries spend more of their disposable income on fuel for cooking food than they have to spend on food itself. Most of these are tropical countries where, ironically, there is ample sunlight to power many of the people’s basic needs. In certain areas, there is often an abundance of wind energy. Turbines can easily capture enough of this wind energy to, say, power light bulbs or charge batteries. What is lacking is the technology—at an affordable price for those
who need it most—for people to tap into these and other sources of
natural renewable energy. Before engineers can develop such technology,
they need to know how much of a given type of energy is available, and
precisely when and where. Specifically, for any given locale, engineers
need accurate data collected over a long period of time. Any system for
harnessing a natural renewable energy resource must be adapted for the
location where the technology is to be used. |
Arid areas with few cloudy days are ideal locations for solar power, as long as they aren’t too far north or south (if you want electricity in the winter, at least). This experimental solar power station in California’s Mojave Desert uses light reflected by mirrors to heat molten salt to 565°C (1050°F). The salt then boils water which drives a steam turbine to generate electricity. Other solar power technologies are smaller and more distributed, such as photovoltaic solar cells and even low-tech solar ovens. (Photograph courtesy National Renewable Energy Laboratory) | ||
Thanks to the initiative of a team of scientists at NASA’s Langley Research Center (LaRC), engineers and amateur inventors worldwide now have free access to global-scale data on insolation (or incoming sunlight), wind speed and direction, and a range of meteorological variables. Moreover, the LaRC team translated these data into an easy-to-use format so that they plug seamlessly into a new generation of software tools that engineers use to design energy-efficient systems. Already, private companies are using these NASA data to design, build, and market new systems for harnessing renewable energy resources. But the best part is that these new systems will be marketed at affordable prices in underdeveloped countries for those who need them most. The data used in this study are available in one or more of NASA's Earth Science Data Centers. |
Wind power is another type of alternative energy suitable for undeveloped areas. State-of-the-art wind turbines can generate electricity; or windmills can perform simple tasks like pumping water. (Photograph courtesy National Renewable Energy Laboratory) |
|
Subscribe to the Earth Observatory About the Earth Observatory Contact Us Privacy Policy and Important Notices Responsible NASA Official: Lorraine A. Remer Webmaster: Goran Halusa We're a part of the Science Mission Directorate |