|
||
|
|
||
 |
|||
|
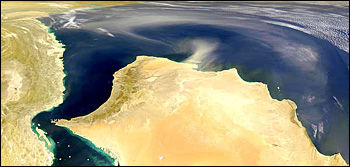
When large numbers of fish began dying in droves off the northern coast of
Oman in the Persian Gulf in late August 2000, the local media reported that the
deaths were due to the release of contaminated ballast water from a U.S. tanker
visiting the area. Meanwhile, Omani authorities feared that a toxic algal bloom
was killing the fish, raising concerns about health and food security for their
nation’s fishing industry.
|
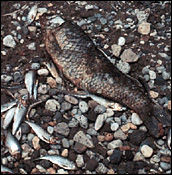 Fish kills can have varied causes, including pollution and harmful algal blooms. (Image courtesy of the Environmental Protection Agency) 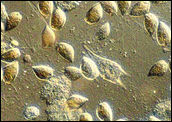 Dinoflagellates can cause disease among marine organisms and humans. (Image courtesy of NOAA) For more information, see What are phytoplankton? Title graphic photo courtesy Garcy Ward. |
Neither was true, say a collaborating team of oceanographers and marine biologists from the Marine Science and Fisheries Centre (MSFC) in Oman, North Carolina State University, and the University of Miami. Using data from two NASA Earth Observing System (EOS) satellites, the team of researchers demonstrated that the fish kill was due to a series of natural environmental changes that severely reduced the oxygen content of the surface waters. Ironically, at the time of the fish kill in early September 2000, Dr. John M. Morrison, professor of oceanography at North Carolina State University, was already in Oman working with scientists from the Ministry of Agriculture and Fisheries. He was helping the Ministry upgrade their local capability to use satellite remote sensing techniques to allow them to process imagery in near real time as part of an ongoing effort by the Ministry to forecast conditions in the Gulf of Oman. “With support from the Ministry, a satellite data downlink station was installed in Oman in 1996 as part of an international program to study the role of the Indian Ocean in the ocean carbon cycle,” explains Morrison. “This station enables them to receive AVHRR and SeaWiFS data transmitted directly from the overpassing satellites. Since that time we have had an ongoing program to train local scientists in operating the station as well as in processing and interpreting satellite images, both for scientific use and as a part of their fisheries advisory program.” (“AVHRR” is NOAA’s Advanced Very High Resolution Radiometer and “SeaWiFS” is Orbital Sciences Corporation’s Sea-viewing Wide Field-of-view Sensor.) Shortly after Morrison arrived in Muscat on September 2, the Ministry’s Assistant Director General for Fisheries and Guidance Eng Saud Bin-Humud al-Habsi informed the team that a large fish kill was taking place off the Batinah region of Oman’s northern coast. There was a heightened sense of urgency given that the fish kill was happening during the peak harvest time of the fishing season. Fisheries exports are one of Oman’s chief sources of revenue. “The Ministry wanted satellite imagery to help them define the extent of the problem and help resolve whether the problem was caused by a toxic plankton bloom or red tide, or whether it was an oxygen problem,” Morrison states. “The imagery would help them resolve whether there was upwelled water in the area of the fish kill.” Occurrences of red tide blooms are a common phenomenon in the coastal waters of Oman. The abnormal production of all groups of phytoplankton (diatoms, dinoflagellates, and blue-green algae) lead to discoloration of surface waters there and unfortunately some of these phytoplankton are toxic, causing mass mortality of marine organisms. Another common cause of fish kills in this region is oxygen-depleted water upwelling to the surface. Each cause carries vastly different implications. Oxygen depletion raises no concerns about food security, while concerns about toxic blooms can seriously damage Oman’s fish exports and local consumption.
Omani scientists know the Gulf of Oman and Arabian Sea contain oxygen-poor water at depths of about 100 meters (328 feet) below the surface. This oxygen-poor layer is due to the fact that the whole northern Arabian Sea is so highly productive (fertile for growth of plankton and other microorganisms). Although phytoplankton and other marine biota have relatively short lifespans (roughly 1-3 days), under the right conditions they have the capacity to reproduce, or “bloom,” into exponentially large numbers in a matter of days. Over time, these biota die at the surface and begin to sink to the bottom as detritus. As this detritus sinks it decays, thereby using up oxygen in the water column. Consequently, the Arabian Sea has one of the thickest oxygen-depleted layers of ocean water found anywhere in the world. Sometimes, due to shifts in the overlying wind field, these deep oxygen-poor waters upwell to the surface. So, ironically, the very reason that Oman’s fish reserves are the largest in the world also indirectly leads to periodic mass fish kills. According to Morrison, the satellite imagery gave a quick, early indication that there was indeed an upwelling event along the coast of Oman. Some of the water was being upwelled in the Batinah region where the fish kill was located, and some oxygen-poor water was being upwelled to the south and carried into the region as part of a narrow coastal current. Analysis of remotely-sensed sea surface temperature data showed that cool upwelled water appeared at the surface along the Batinah coast as early as August 21, 2000, reaching coolest temperatures by the time of the peak of the fish kill on September 4, 2000. |
|
These false-color images show sea surface temperature in the Gulf of Oman on August 27 and September 7, 2000, as measured by the MODIS sensor aboard NASA's Terra satellite. Data from the QuikScat sensor aboard NASA's SeaWinds satellite were overlaid to show the direction and intensity of surface winds on those same days. The many tiny icons are metaphors for flags. They blow in the direction of the wind; the longer the flag, the stronger the wind. Together, these data sets illustrate how a shift from the prevailing wind pattern caused the relatively sudden and dramatic changes in the gulf's sea surface temperature. The colder, oxygen-poor waters of the gulf were churned up to the surface, thus triggering the fish kill. Ocean temperatures are cooler to warmer from blue to red. Dark gray areas are land, and light gray areas are cloud-covered. (Images by Jesse Allen; Data courtesy Bob Evans, MODIS Ocean Science Team, University of Miami) Click here for a time series. |
|||
|
It is interesting to note that the fish kill was preceded by unusually high catches. In situ data collected by personnel from the Oman MSFC showed that as early as August 20, 2000, fish had begun to school in pockets of relatively oxygen-rich water (greater than 2.0 parts per million, or ppm) surrounded by oxygen-depleted water (less than 1 ppm), leading to increased vulnerability and high catches by September 4. Conversely, in some areas, oxygen content fell to between 0.5 and 1 ppm, killing the fish. Thus, the remote sensing data and the in situ data allowed the Ministry to issue a press release stating that the fish kill was due to oxygen-depleted water and not a toxic red tide event, allaying the fears of the local populace as well as the fisheries. So, what led to this fish kill? On his return to the United States, Morrison continued to work with the MSFC and Dr. Robert Evans, professor of oceanography at the University of Miami, to meld the in situ data and satellite data collected in Oman with data from the Moderate Resolution Imaging Spectroradiometer (MODIS). The researchers measured sea surface temperature and ocean color, from which they derived the chlorophyll content of the water. (Chlorophyll is the green pigment used by phytoplankton for photosynthesis.) By correlating MODIS’ measurements with in situ data, oceanographers can study the relationship between water temperature, current patterns, and biological productivity over very large areas. The team also gathered scatterometry data from NASA’s QuikScat satellite that enable scientists to map the direction and intensity of surface winds over the world’s oceans and seas. The QuikScat data revealed that during the fish kill the winds in the region changed from their usual southerly direction to a more easterly direction. These winds dragging across the surface of the Gulf of Oman effectively pushed the warm surface water eastward, away from Oman, thereby allowing the deeper, oxygen-poor waters to upwell along the coast. “As the upwelling event began,” notes Morrison, “the in situ data began to show pockets of low-oxygen content water interspersed with pockets of high-oxygen waters, where fish began to school.” It didn’t take the local fishermen long to figure out where to catch the fish. Over a span of days in late August, Omani fishermen harvested near-record numbers of sardines, tuna, grouper, kingfish, hammour, and shrimp as the fish schooled in pockets of high-oxygen water that were decreasing in size. Likewise, the fish trapped in the low-oxygen water were suffering from a slower metabolism, thus making them swim slower and again rendering them easier prey for fishing nets. “The interesting thing,” states Morrison, “is that fish kills associated with oxygen deficit conditions are normally preceded by anomalously large catches which are a boon to fishermen. But the concern of the Ministry is that they want to know what those precursor conditions are. If Omani fishermen are catching and selling fish killed by a toxic red tide, then they could be unknowingly introducing these toxins into the human food chain and that would be disastrous to their market.” According to Evans, the team not only learned some lessons about this particular event, they also learned some valuable lessons about the new MODIS sensor. First launched in December 1999 aboard NASA’s Terra satellite, MODIS opened its doors and began acquiring data on February 24, 2000. While one of MODIS’ objectives is to measure global sea surface temperatures more accurately than ever before, Evans says the MODIS Ocean Team spent most of the first year of operations fine tuning their algorithms and calibrating the sensor. The fish kill in the Gulf of Oman gave them their first real opportunity to test MODIS’ new capability. “Because MODIS provides higher spectral resolution and more channels for measuring sea surface temperature, we can better distinguish surface features in the data,” explains Evans. “Even though MODIS has the same ‘footprint’ (surface area per pixel in its ocean-sensing bands) resolution as AVHRR, we can see temperature patterns at much finer resolution.” Moreover, adds Morrison, the higher spectral resolution of MODIS also gives scientists a vastly improved ability to remove the effects of clouds and aerosol particles for a less obstructed view. “We’re learning that a lot of what we thought was cloud cover in AVHRR and SeaWiFS data over this region is really water vapor or dust particles, or other contaminates in the air,” he states. “Using MODIS data, Bob (Evans) was able to remove the effects of these atmospheric features, giving us a better look at the surface.” This improved satellite performance is important because, as any fisherman knows, fish catches are very patchy. Fish tend to school around areas where there is ample food — areas where there is high productivity of phytoplankton and other marine biota. These fertile areas are often driven by current patterns in which upwelling often brings the nutrient-rich waters into the sunlight to nourish phytoplankton blooms. Because it is difficult to predict where and when local upwelling events will take place, and because the ocean is such a vast place, it is difficult for scientists to study this dynamic from research vessels on the surface. “Satellites give us a much broader perspective to help us understand the patchiness versus a whole region,” says Morrison. “You can’t get that from a ship-based perspective.” Ultimately, he says, their goal is to understand both on a local and global scale, the complex dynamics of upwelling and biological response. They want to solve the long-standing mystery of the ocean’s role in the global carbon cycle. But these data are not only beneficial for Earth scientists, they provide practical applications for the fishing industry as well. The data used in this study are available in one or more of NASA's Earth Science Data Centers. |
|||
|
Subscribe to the Earth Observatory About the Earth Observatory Contact Us Privacy Policy and Important Notices Responsible NASA Official: Lorraine A. Remer Webmaster: Goran Halusa We're a part of the Science Mission Directorate |
|
|