|
Upper Ocean Heat Content Anomaly
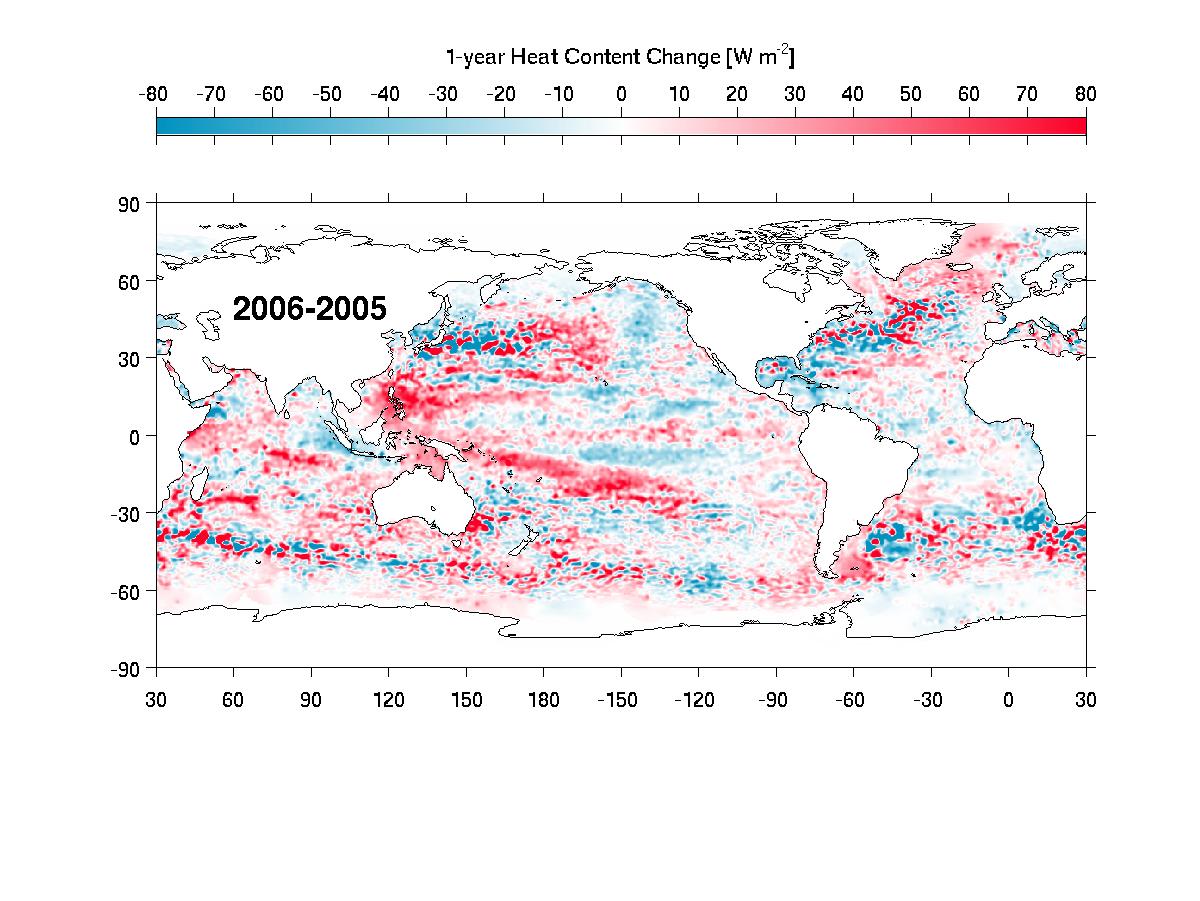
The map shows an
estimate of the change in upper Ocean Heat Content Anomaly (OHCA) from
2005 to 2006 derived from both in situ data and altimeter sea surface
height mapping performed according to Willis
et al. 2004.
Historical
data are from XBTs, CTDs, moorings, and other sources. A
preliminary ad-hoc fall rate correction has been applied
to the XBT data in an attempt to correct for biases between XBT data
and more
accurate CTD data. Additional displays of the
upper OHCA and sampling error are available in the Plots section.
 |
Recent
estimates are based primarily on Argo
profiling CTD float data. Satellite altimeter data from Aviso
are used to estimate errors |
|
|