

Hispanic/Latino Profile
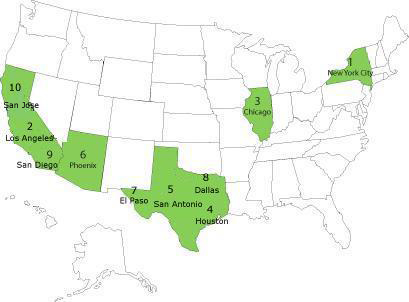
(Map of the US with the top 10 cities displaying the
largest Hispanic/Latino population according to the Census Bureau)
New York City, NY - Los Angeles, CA  - Chicago, IL - Houston, TX -
San Antonio, TX - Phoenix, AZ - El Paso, TX - Dallas County, TX - San Diego, CA - San Jose, CA
- Chicago, IL - Houston, TX -
San Antonio, TX - Phoenix, AZ - El Paso, TX - Dallas County, TX - San Diego, CA - San Jose, CA
Overview (Demographics): This ethnic group includes any person of Cuban, Mexican, Puerto Rican, South or Central American, or other Spanish culture or origin, regardless of race. According to the 2006 U.S. Census Bureau population estimate, there are roughly 44.3 million Hispanics living in the United States. This group represents almost 15 percent of the U.S. total population. In 2004, among Hispanic subgroups, Mexicans rank as the largest at 66 percent. Following Mexicans are: Central and South Americans (13 percent), Puerto Ricans (9.4 percent), Cubans (3.9 percent) and the remaining 7.5 percent are people of other Hispanic origins. States with the largest Hispanic populations are California (13 million), Texas (8 million), New York (3 million), Florida (3.6 million), and Illinois (1.9 milion). Another significant point is that in 2004, 34.3 percent of Hispanics were under the age 18 in comparisons to 22.3 percent of non-Hispanic Caucasians. Among Hispanics, Mexicans have the largest proportion of people under age 18, at 36 percent.
Language Fluency: A 2002 study conducted by the Pew Hispanic Center concluded that language fluency varies among Hispanic subgroups who reside within the mainland United States. The number of Hispanics who speak only English at home: 3.9 million for Mexicans, 763,875 for Puerto Ricans, 163,599 for Cubans and 1.8 million for other Hispanic/Latino groups. The number of Hispanics who speak Spanish at home: 14.5 million for Mexicans, 2.3 million for Puerto Ricans, 1 million for Cubans and 6.7million for other Hispanic/Latino groups.
Educational Attainment: According to a 2006 U.S. Census Bureau report, 55 percent of Hispanics in comparison to 85 percent non-Hispanic Caucasians have a high school diploma. 10 percent of Hispanics in comparison to 24.6 percent of non-Hispanic Caucasians have a bachelor’s degree.
Economics: According to a 2004 U.S. Census Bureau report, 24.6 percent of Hispanics in comparison to 13.4 percent non-Hispanic Caucasians work within service occupations. 16.8 percent of Hispanics in comparison to 39.1 percent of Caucasians work in managerial or professional occupations. Among full-time year-round workers in 2004, 29.4 percent of Hispanics in comparison to 57.5 percent of non-Hispanic Caucasians earned $35,000 or more. According to the same 2004 study, 22.5 percent of Hispanics in comparison to 8.2 percent of non-Hispanic Caucasians were living at the poverty level. Hispanics represented 14 percent of the total U.S. population but constituted 21.8 percent of the population living in poverty.
Insurance Coverage: It is significant to note that Hispanics have the highest uninsured rates of any racial or ethnic group within the United States. In 2004 the Centers for Disease Control and Prevention reported that private insurance coverage among Hispanic subgroups varied as follows: 39.1 percent of Mexicans, 47.3 percent of Puerto Ricans, 57.9 percent of Cubans, 45.1 percent of other Hispanic and Latino groups. 2004 Medicaid coverage varied among Hispanic subgroups: 22.4 percent of Mexicans, 29.1 percent of Puerto Ricans, 17.9 of Cubans, and 20.8 percent of other Hispanic or Latino groups. Those without health insurance coverage varied among Hispanic subgroups: 37.6 percent of Mexicans, 20.4 percent of Puerto Ricans, 22.8 percent of Cubans and 32.3 percent of other Hispanic or Latino groups.
Full Census Reports:
We the People: Hispanics in the United States
(December 2004)
The American Community Survey - Hispanics: 2004
Language Use and English-Speaking Ability: 2000
Income, Poverty, and Health Insurance Coverage in the United States: 2006 report
Health: Hispanic health is often shaped by factors such as language/cultural barriers, lack of access to preventive care, and the lack of health insurance. The Centers for Disease Control and Prevention has cited some of the leading causes of illness and death among Hispanics, which include heart disease, cancer, unintentional injuries (accidents), stroke, and diabetes. Some other health conditions and risk factors that significantly affect Hispanics are: asthma, chronic obstructive pulmonary disease, HIV/AIDS, obesity, suicide, and liver disease.
Other Health Concerns: Hispanics have higher rates of obesity than non-Hispanic Caucasians. There are also disparities among Hispanic subgroups. For instance, while the rate of low birth weight infants is lower for the total Hispanic population in comparison to non-Hispanic Caucasians, Puerto Ricans have a low birth weight rate that is 50 percent higher than the rate for non-Hispanic Caucasians. Also Puerto Ricans also suffer disproportionately from asthma, HIVAIDS and infant mortality. Mexican-Americans suffer disproportionately from diabetes.
Quick Facts
Cancer
- In 2004, Hispanic men were 13% less likely to have prostate cancer as non-Hispanic white men.
- In 2004, Hispanic women were 33% less likely to have breast cancer as non-Hispanic white women.
- Hispanic men and women have higher incidence and mortality rates for stomach and liver cancer.
- In 2003, Hispanic women were 2.2 times as likely as non-Hispanic white women to be diagnosed with cervical cancer.
For more statistics on Hispanics and cancer, please click here
Diabetes
- Mexican American adults were 2 times more likely than non-Hispanic white adults to have been diagnosed with diabetes by a physician.
- In 2002, Hispanics were 1.5 times as likely to start treatment for end-stage renal disease related to diabetes, as compared to non-Hispanic white men.
- In 2004 Hispanics were 1.5 times as likely as non-Hispanic Whites to die from diabetes.
For more statistics on Hispanics and diabetes, please click here
Heart Disease
- In 2005, Hispanics were 10% less likely to have heart disease, as compared to non-Hispanic whites.
- In 2004 Mexican American men were 30% less likely to die from heart disease, as compared to non-Hispanic white men.
- Mexican American women were 1.3 times more likely than non-Hispanic white women to be obese.
For more statistics on Hispanics and heart disease, please click here
HIV/AIDS
- Hispanics accounted for 18% of HIV/AIDS cases in 2005.
- Hispanic males had over 3 times the AIDS rate as non-Hispanic white males.
- Hispanic females had over 5 times the AIDS rate as non-Hispanic white females.
- Hispanic men were 2.6 times as likely to die from HIV/AIDS as non-Hispanic white men.
- Hispanic women were 4 times as likely to die from HIV/AIDS as non-Hispanic white women in 2004.
For more statistics on Hispanics and HIV/AIDS, please click here
Immunization
- In 2005 Hispanic adults aged 65 and older were 10% less likely to have received the influenza (flu) shot in the past 12 months, as compared to non-Hispanic whites of the same age group.
- In 2005, Hispanic adults aged 65 and older were 50% less likely to have ever received the pneumonia shot, as compared to non-Hispanic white adults of the same age group.
- Although Hispanic children aged 19 to 35 months had comparable rates of immunization for hepatitis, influenza, MMR, and polio, they were slightly less likely to be fully immunized, when compared to non-Hispanic white children.
For more statistics on Hispanics and immunization, please click here
Infant Mortality
- In 2004, infant mortality rates for Hispanic subpopulations ranged from 4.6 per 1,000 live births to 7.8 per 1,000 live births, compared to the non-Hispanic white infant mortality rate of 5.7 per 1,000 live births.
- In 2004, Puerto Ricans had 1.4 times the infant mortality rate of non-Hispanic whites.
- Puerto Rican infants were twice as likely to die from causes related to low birthweight, as compared to non-Hispanic white infants.
- Mexican American mothers were 2.5 times as likely as non-Hispanic white mothers to begin prenatal care in the 3rd trimester, or not receive prenatal care at all.
For more statistics on Hispanics and infant mortality, please click here
Stroke
- In 2004, Hispanic men were 14% less likely to die from a stroke than non-Hispanic white men.
- In 2004 Hispanic women were 30% less likely to die from a stroke than non-Hispanic white women.
For more statistics on Hispanics and stroke, please click here
You will need Adobe Acrobat® Reader™ to view PDF files located on this site. If you do not already have Adobe Acrobat® Reader™, you can download here for free.