Energy Information Administration Logo. If you need assistance viewing this page, please call (202) 586-8800 This Week In Petroleum
EIA Home > Petroleum > This Week In Petroleum
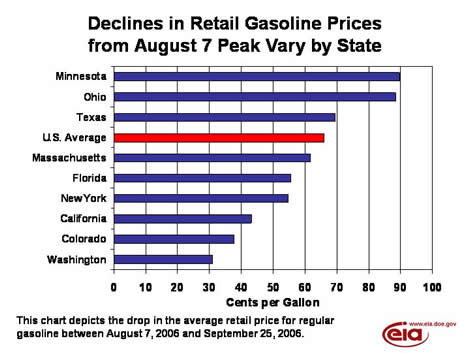


Released on September 27, 2006
(Next Release on October 4, 2006)


Depending on Where You Live
As a Federal Government agency, the Energy Information Administration (EIA) tends to focus more on analyzing national price trends as opposed to trends in individual states. However, EIA collects some data at the state level on the weekly survey for retail gasoline prices (released every Monday afternoon, except on holidays when Monday’s prices are released on Tuesday). EIA releases average prices for nine individual states in various parts of the country. Recently, every region in the United States has seen significant drops in the average retail price for regular gasoline, with the U.S. average dropping by 66 cents per gallon during the seven-week period between August 7 and September 25. But as the graph below illustrates, the drop has not been uniform across the country.

Declines in Retail Gasoline Prices 
from August 7 Peak Vary by State

Some states, particularly those in the Midwest, such as Minnesota and Ohio, have seen retail gasoline prices drop by almost 90 cents per gallon. Other states, such as those along the West Coast (Washington and California) and the Rocky Mountains (Colorado) have seen prices drop by less than 50 cents per gallon. While people in the Midwest are generally happy to see their prices drop more than the national average, EIA has received calls from areas along the West Coast and Rocky Mountain regions, as well as New York and Florida, wondering why their states have not seen prices fall as much as the national average. While many factors may influence the level of decline and EIA does not have the local knowledge necessary to fully answer these questions, we can identify some potential reasons for price declines to be less in some areas than in others.

Generally speaking, areas that are more isolated from sources of supply outside the region tend to see prices decline less than the national average in times of increased supply. Retail gasoline prices nationally have dropped in large measure due to increased supplies (as a result of high prices earlier in the summer) arriving at the same time as demand started falling for seasonal reasons. However, if you live in an area that tends to receive most of its supply from within the region, while most of the increase in supply nationally originates outside that region, prices would not be expected to fall as much as the national average. While many different regional breakdowns are possible, EIA collects most U.S. regional petroleum data at the level of the five Petroleum Allocation for Defense Districts (PADD). Both the West Coast (PADD V) and the Rocky Mountain (PADD IV) regions tend to meet most of their gasoline demand from refineries servicing those areas, with very little supply coming from the Gulf Coast (PADD III) region. This might help explain why states such as Washington, Colorado, and California have seen a much smaller decline in prices than many other states. Conversely, states in the Midwest region (PADD II) are supplied from refineries within the region as well as by pipelines delivering products refined on the Gulf Coast. It appears that access to such extra supply may be why these states have seen larger price declines recently.

Whether retail prices on the West Coast and Rocky Mountain regions will see larger price declines than other areas in the weeks to come remains to be seen. Ultimately, local supply and demand conditions will be the key factor in determining how much of a decline will ultimately occur. Depending on where you live, you may have seen a larger or smaller decline than the national average. Nevertheless, everyone has seen a significant drop in retail gasoline prices, which is good news for consumers.

A Brief Note on Year-Ago Demand Comparisons
EIA supply data for the four weeks ending September 22, released earlier today, showed that gasoline product supplied (a proxy for demand) was up 3.8 percent compared to the same four-week period last year. However, it is important to remember that last year’s demand data were significantly affected by Hurricane Katrina, making demand this year seem greater in comparison than it would otherwise. Thus, any oil demand comparisons to last year over the next few weeks may seem somewhat larger than typical or expected, due to the effect last year’s hurricanes had in dampening demand temporarily.

U.S. Average Retail Gasoline Price Falls Another 12 Cents
The U.S. average retail price for regular gasoline fell 11.9 cents last week to hit 237.8 cents per gallon as of September 25, which is 42.5 cents lower than a year ago. Prices fell for the seventh week in a row, to the lowest national average price since March 13, 2006. East Coast prices fell 14.4 cents to 238.4 cents per gallon, while the Midwest saw prices fall 11.2 cents to 220.7 cents per gallon. West Coast prices were still the highest in the nation after falling 8.8 cents to 271.8 cents per gallon, the lowest price in that region since April 3. California prices were also 8.8 cents lower at 276.0 cents per gallon, which is 18.7 cents lower than this time last year.

Retail diesel fuel prices fell by 11.8 cents to reach 259.5 cents per gallon as of September 25, 20.3 cents lower than last year. This is the sixth week in a row that prices have fallen. Prices were down throughout the country, with the Rocky Mountains seeing the largest regional decrease of 22.5 cents to 282.7 cents per gallon. West Coast prices, the highest regional prices in the country, averaged 12.2 cents lower to hit 289.2 cents per gallon, the first time the price has been below the $3 mark since April 17.

September Propane Stockbuild Continues Strong
With propane inventories up about 5.2 million barrels so far during September, the nation’s primary supply of propane is more than likely to surpass 70 million barrels by the end of the month, a level well within the comfort range prior to the start of the approaching winter heating season. Last week, propane inventories rose by 1.7 million barrels, continuing the trend of million-barrel-plus stock additions seen over the last several weeks, with inventories reaching an estimated 69.0 million barrels as of September 22, 2006. However, despite the strong weekly gain, inventory additions were limited to the Gulf Coast region, which reported a 1.9-million-barrel increase. In other regions, inventories remained relatively unchanged in the East Coast and the combined Rocky Mountain/West Coast areas, while at the same time, inventories declined by 0.2 million barrels in the Midwest. Propylene non-fuel use inventories also remained unchanged last week, but accounted for a marginally lower 3.9 percent of total propane/propylene inventories compared with a prior week’s 4.0 percent share.

Text from the previous editions of “This Week In Petroleum” is now accessible through a link at the top right-hand corner of this page.


Retail Prices (Cents Per Gallon)
Conventional Regular Gasoline Prices Graph. On-Highway Diesel Fuel Prices Graph.
Retail Data Changes From Retail Data Changes From
09/25/06 Week Year 09/25/06 Week Year
Gasoline 237.8 values are down-11.9 values are down-42.5 Diesel Fuel 259.5 values are down-11.8 values are down-20.3
Spot Prices (Cents Per Gallon)
Spot Crude Oil WTI Price Graph. New York Spot Diesel Fuel Price Graph.
New York Spot Gasoline Price Graph. New York Spot Heating Oil Price Graph.
Spot Data Changes From
09/22/06 Week Year
Crude Oil WTI 59.79 values are down-3.51 values are down-4.88
Gasoline (NY) 150.8 values are down-11.5 values are down-49.8
Diesel Fuel (NY) 165.5 values are down-2.6 values are down-34.5
Heating Oil (NY) 157.9 values are down-7.2 values are down-32.7
Propane Gulf Coast 94.5 values are down-5.8 values are down-22.0
Note: Crude Oil WTI Price in Dollars per Barrel.
Gulf Coast Spot Propane Price Graph.
Stocks (Million Barrels)
U.S. Crude Oil Stocks Graph. U.S. Distillate Stocks Graph.
U.S. Gasoline Stocks Graph. U.S. Propane Stocks Graph.
Stocks Data Changes From Stocks Data Changes From
09/22/06 Week Year 09/22/06 Week Year
Crude Oil 324.8 values are down-0.1 values are up19.1 Distillate 151.3 values are up2.6 values are up17.7
Gasoline 213.9 values are up6.3 values are up14.1 Propane 68.950 values are up1.640 values are up1.561