|
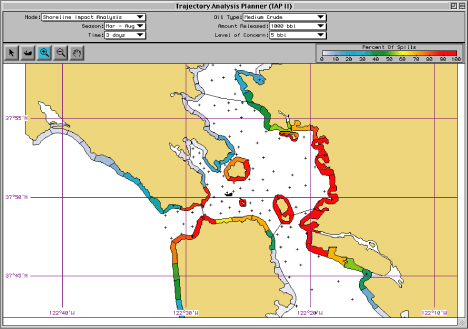
Trajectory Analysis Planner (TAP)
Trajectory Analysis Planner (TAP) is a software tool designed to help answer the crucial question in any Area Contingency Plan: How do I develop a plan that protects my area against likely spills?
What TAP Does
TAP presents graphical output in five modes:
- Shoreline Impact Analysis helps to answer: If oil is spilled at a given spot, what shoreline locations are likely to be affected?
- Response Time Analysis helps you estimate how quickly a response must be mounted at a location of concern to precede the arrival of the oil.
- Site Oiling Analysis helps you visualize how a location of concern would be likely to be oiled by a spill at a given location.
- Threat Zone Analysis helps to answer: Where might a spill occur that could threaten a particular location of concern?
- Resource Analysis helps you estimate the level of response needed to adequately address impacts of modeled spills, and the quantity of a particular resource that could be impacted by given spills.
How TAP Works
You use TAP to see the probability that any oil spill will reach a specific segment of shoreline. TAP analyzes statistics from potential spill trajectories generated by the NOAA OR&R (Office of Response and Restoration) oil spill trajectory model, GNOME (General NOAA Operational Modeling Environment, see link below). This model predicts how an oil spill will spread and move within a local area. It takes into account:
- the bathymetry and shoreline configuration of a particular body of water, including its channels, bays, and significant rivers;
- currents and winds; and
- shoreline characteristics that determine beaching and refloating of oil.
Then for each season, the model generates 500 individual oil spill trajectories from each of about 200 potential spill locations. The model then compiles statistics for where, when, and how much oil impacts receptor sites into data files for TAP.
TAP displays a map of a specific local area, including a major water body and the adjacent land. The map displays shoreline segments that represent the locations of shoreline resources such as seabird colonies or marine mammal hauling grounds; sites of particular socioeconomic value, such as tourist beaches or large marinas; or areas where remediation measures would be difficult or expensive. You can use TAP to evaluate the probable threat to any of these sites from an oil spill that originates at any point within the mapped water body.
TAP's Status
Versions of TAP have been developed for these locations:
- San Francisco Bay, California
- San Diego Bay, California
- Puget Sound, Washington
- Kaneohe Bay, Hawaii
- Lake Calcasieu, Louisiana
- Lake Sabine, Texas and Louisiana
- Inchon Harbor, Korea
- Persian/Arabian Gulf
Versions are in progress for Timbalier Bay, Louisiana and North Slope, Alaska. To obtain a copy of TAP for an existing region, contact our TAP Specialist (see link below).
Related Information and Tools
|
- TAP Specialist Contact our TAP Specialist to order TAP for an existing region.
|
- GNOME Oil spill planners and responders use the oil trajectory model, GNOME, to predict how wind, currents, and other processes might move and spread oil that has spilled on the water. GNOME is used to compute the oil spill trajectories used by TAP.
|
- Environmental Sensitivity Index (ESI) Maps To decide which areas in a given region are most important to protect and eventually to clean up, responders use our Environmental Sensitivity Index (ESI) maps of the region. You can obtain paper or electronic ESI maps for many regions of the U.S.
|
- ADIOS2 Use the oil weathering model, ADIOS2, to predict how an oil slick can weather (change its properties) over time.
|
Downloads
|
- TAP Fact Sheet A short fact sheet that describes the Trajectory Analysis Planner (TAP) in more detail.
(Document format: PDF, size: 657.9 K)
|
- TAP II 1.1 User Manual A user manual that describes TAP and its five modes, explains strategies for using TAP modes to create and revise area contingency plans, and answers frequently asked questions about TAP.
(Document format: PDF, size: 409.8 K)
|
|
|
|