|
Graphing Changes in Marine Life Abundance
Want to try your hand at some marine biology? Then grab your raingear and follow the steps below to make a study of the marine life occupying a section, or quadrat, of Mearns Rock (a boulder in Prince William Sound, Alaska, that was oiled in 1989 by the Exxon Valdez oil spill). For your study, you'll use a series of zoomed-in photos of that quadrat. Each shows a different year from 1990 to 2004. Your goal will be to see how the percent cover of mussels, barnacles, and Fucus gardneri (a kind of seaweed, also called rockweed) in this study area has changed during those 14 years.
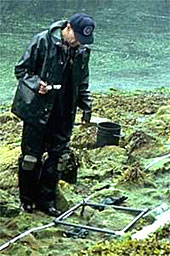
As you complete this project, you'll be using the same method used by real marine biologists. To study how marine life abundance changes from one year to the next, marine biologists sometimes section off a small plot of land that's representative of the particular habitat they're studying (for example, a rocky shoreline or a bog). They use a frame (generally a 0.25 or 0.5 square meter of rebar or PVC pipe), known as a quadrat (or "quad" for short), which they place on the ground to mark an area to study in depth. Each year, the biologists return to count the organisms or plants that occupy the area inside the quad. In the photo above, one of our marine biologists is using a quad in his studies of the Mearns Rock site. He's trying to find out how the abundance of Fucus, barnacles, mussels, and other organisms changed over the years following the Exxon Valdez oil spill.
1. Before You Begin
Collect the resources you'll need:
Use the link at right to open our mini field guide. You'll use it to recognize the species in your quad, estimate their percent cover, and establish the criteria you'll use to make your observations.
Open and print out our data table, using the link at right. You'll use it to record your estimates of percent cover.
2. Observe and Record
Now use the Mearns Rock Quadrats link, at right, to open the series of high-resolution photos of the same quadrat of Mearns Rock, taken each year from 1989 to 2004. As you examine each photo in the series, try to estimate how much of the quadrat that Fucus occupies (as a percent of the total area), how much of the quadrat mussels occupy, and how much of it barnacles occupy. Record your estimates in the data table you printed out.
3. Plot Your Data
Your final step will be to graph your data, so that you can see trends over time in the relative abundance of the three species in the quadrat. Your graphs will look similar to those that marine ecologists make after actually measuring the amount of cover!
Use the link at right to open and print timeline graphs. You'll plot your data on these graphs.
Tips for Making Your Observations
Look for Color Ranges
Because these photos were taken at different times of day and under different weather and light conditions, they vary in their color and clarity. Watch for four color ranges to identify the marine life:
- Gray areas tend to be bare rock.
- Black areas are often mussels.
- Areas that range from green to gold to brown are often Fucus gardneri (rockweed or popweed). Young Fucus plants are more green in color, mature plants are more brown.
- White or light gray regions tend to be barnacles.
Observation Criteria
As you look through the photos, you will note that algae or seaweed sometimes cover much of the rock, possibly hiding barnacles and mussels from our view. Before making your estimates, first establish the criteria that you'll follow. For example, consider basing your observations on "what's visible" rather than on your best guess of what might be living underneath something else.
Something to Consider
As you look through these photos, consider the intense competition for space that exists among marine life forms in the intertidal region. For example, if sea otters clear mussels off a section of the rock, that opens space for barnacles, Fucus, or other organisms to "move in" to that space. You'll see several examples in these photos.
|