|
||
|
|
||
| Information courtesy of NASA's Jet Propulsion Laboratory. Additional information can be found at winds.jpl.nasa.gov |
|
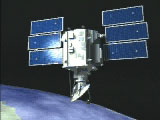
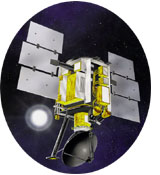
Built in a record time of just 12 months, QuikScat will provide climatologists, meteorologists and oceanographers with daily, detailed snapshots of the winds swirling above the world's oceans. Labeled as NASA's next "El Niño watcher," QuikSCAT will be used to better understand global weather abnormalities and to generally improve weather forecasting. QuikSCAT's predecessor, NSCAT (NASA Scatterometer), a microwave radar scatterometer, measured near-surface wind vectors (both speed and direction) over the global oceans starting in August 1996. The QuikSCAT mission is a "quick recovery" mission to fill the gap created by the loss of data from NSCAT, after the satellite it was flying on lost power in June 1997. Winds play a major role in every aspect of weather on Earth. They directly affect the turbulent exchanges of heat, moisture and greenhouse gases between Earth's atmosphere and the ocean. To better understand their impact on oceans and improve weather forecasting, QuikSCAT carries a state-of-the-art radar instrument called a scatterometer for a two-year science mission. Known as "SeaWinds," this scatterometer operates by transmitting high-frequency microwave pulses to the ocean surface and measuring the "backscattered" or echoed radar pulses bounced back to the satellite. The instrument senses ripples caused by winds near the ocean's surface, from which scientists can compute the winds' speed and direction. The instruments can acquire hundreds of times more observations of surface wind velocity each day than can ships and buoys, and are the only remote-sensing systems able to provide continuous, accurate and high-resolution measurements of both wind speeds and direction regardless of weather conditions. SeaWinds uses a rotating dish antenna with two spot beams that sweep in a circular pattern. The antenna radiates microwave pulses at a frequency of 13.4 gigahertz across broad regions on Earth's surface. The instrument is currently collecting data over ocean, land, and ice in a continuous, 1,800-kilometer-wide band, making approximately 400,000 measurements and covering 90% of Earth's surface each day. next: History of Scatterometry
|

Scatterometry
Other Relevant Ocean Fact Sheets:
|
|
A History of Scatterometry
The first scatterometer flew as part of the Skylab missions in 1973 and 1974, demonstrating that spaceborne scatterometers were indeed feasible. Then, from June to October 1978, the Seasat-A Satellite Scatterometer (SASS) proved that accurate wind velocity measurements could be made from space. In the 1990s, a single-swath (-beam) scatterometer was one of the instruments to fly on the European Space Agency's ERS-1 (currently in stand-by mode) and ERS-2 Remote Sensing Satellites, launched in July 1991 and April 1995 respectively. The NASA Scatterometer (NSCAT) which launched aboard Japan's ADEOS-Midori Satellite in August, 1996, was the first dual-swath, Ku-band scatterometer to fly since Seasat. From September 1996, when the instrument was first turned on, until premature termination of the mission due to satellite power loss in June 1997, NSCAT performed flawlessly and returned a continuous stream of global sea surface wind vector measurements. Unprecedented for coverage, resolution, and accuracy in the determination of ocean wind speed and direction, NSCAT data has already been applied to a wide variety of scientific and operational problems. These applications include such diverse areas as weather forecasting and the estimation of tropical rain forest reduction. Because of the success of the short-lived NSCAT mission, future Ku-band scatterometer instruments are now greatly anticipated by the ocean winds user community.
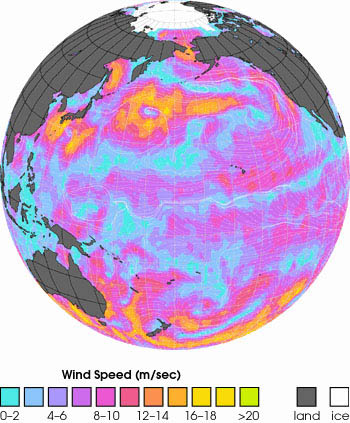
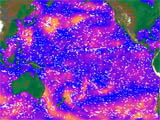
This image shows ocean surface wind speeds and directions over the
Pacific Ocean on September 21, 1996 as they were measured by the NASA
Scatterometer (NSCAT) which was onboard Japan's Advanced Earth Observing
Satellite (ADEOS). The background color indicates wind speed and the
white arrows show the direction of the wind. The strong Trade Winds
(red) blow steadily from the cooler subtropical ocean to the warm water
of the Intertropical Convergence Zone (ITCZ) located just north the
Equator. Instead of blowing in the north-south direction, the winds are
deflected westward by the Coriolis effect, an apparent force arising
from the rotation of the Earth on its axis. The air rises over the warm
water of ITCZ and sinks in the subtropics at the Horse Latitudes,
forming the Hadley Circulation. Both the convergence area at the ITCZ
and the divergence area at the Horse Latitudes are indicated by low wind
speed of blue color. In the sub-tropics and mid-latitudes, hurricanes (typhoons)
rely on some contribution from the Coriolis effect in order to develop
their characteristic spin (yellow spirals). Two typhoons are observed in
the western Pacific. Typhoon Violet is just south of Japan. After these
data were taken, Typhoon Violet struck the East Coast of Japan causing
damage and deaths. Typhoon Tom is located further east and did not make
landfall.
Courtesy of NASA JPL
next: Why is Scatterometry Important?
|
Scatterometry
|
|
Why is Scatterometry Important?
Winds Over the Ocean
|
Scatterometry |
|
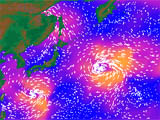
Animations Pacific Surface Winds - This animation shows ocean surface wind speeds and directions over the Pacific as measured by the NSCAT scatterometer on September 20, 1996. Here, wind speed is depicted by the color of the ocean background: blue for low winds, red for moderate winds, and yellow for high winds. The movement of the white arrows shows the direction of the wind at about 00:00 GMT. The underlying wind field was constructed from eight orbits of NSCAT data by using a successive correction interpolation scheme. Noteworthy features manifested in this scene include: Typhoons Violet and Tom in the Northwestern Pacific near Japan, the trade winds and inter-tropical convergence zone near the equator, and strong winter storm activity in the Southern Hemisphere. Typhoons Violet and Tom - This animation shows ocean surface wind speeds and directions in the Pacific ocean near Japan as measured by the NSCAT scatterometer on September 20, 1996. Here, wind speed is depicted by the color of the ocean background: blue for low winds, red for moderate winds, and yellow for high winds. The movement of the white arrows shows the direction of the wind at about 02:00 GMT. The underlying wind field was contructed from four orbits of NSCAT data by using a successive correction interpolation scheme. Typoon Tom is in the upper right hand corner while Typhoon Violet is just south of Japan. Typhoon Violet eventually struck the east coast of Japan causing damage and deaths. next: Applications
|
 QuickTime movie of Pacific surface winds (1.4MB) Courtesy of JPL
|
|
Applications: Observing Oceans from Space
Weather Forecasting - Data from ocean scatterometers greatly enhance overall weather-forecasting capabilities. Most of the weather over the west coast of the United States, and some over the east coast, is generated over the oceans. The measurements derived from ocean scatterometers are assimilated into numerical models (computer programs that represent natural processes in terms of equations), which can be used to predict global and regional weather patterns. The data are delivered to the National Oceanic and Atmospheric Administration (NOAA) within two hours, where they are used for timely, accurate weather forecasting. Storm Detection - The ocean scatterometer data can determine the location, direction, structure and strength of storms at sea. Severe marine storms—hurricanes near the Americas, typhoons in Asian waters, and mid-latitude cyclones worldwide are among the most destructive of all natural phenomena. In the United States alone hurricanes have been responsible for at least 17,000 deaths since 1900, and hundreds of millions of dollars in damage annually. If worldwide statistics are considered, the numbers are substantially higher. Although typically not as violent as hurricanes and typhoons, mid-latitude cyclones exact a heavy toll in casualties and material damage. In recent years, our ability to detect and track severe storms has been dramatically enhanced by the advent of weather satellites. Cloud images from space are now routine on weather reports. Data from ocean scatterometers augment these familiar images by providing direct measurements of surface winds to compare with the observed cloud patterns. These wind data help meteorologists to more accurately identify the extent of gale force winds associated with a storm and provide inputs to numerical models that provide advanced warning of high waves and flooding. Ship Routing - Wind-observation data from ocean scatterometers is of particular significance in ship routing. Prior knowledge of wind behavior will enable ship masters to choose routes that avoid heavy seas or high headwinds that may slow ships' progress, increase fuel consumption, or possibly cause damage to vessels and loss of life. In the past, ship captains relied on widely-spaced measurements from buoys and sporadic, sometimes unreliable reports from other ships. Data from satellite-based scatterometers are much more regular, extensive, and dependable. Oil Production - Earth's oceans are increasingly used as a source of fuel. As continental fossil-fuel supplies are depleted, the more challenging task of extracting oil and gas from the seabed becomes a necessity. Oil and gas production is already ongoing at numerous offshore sites around the world, including the Gulf of Mexico, the North Sea, the Persian Gulf. Thorough knowledge of the historical wind and wave conditions at any specific location is crucial to the design of drilling platforms. Safe, efficient drilling operations depend on an accurate understanding of the current state of the sea as well as warning of impending storms. In the event of an oil spill, surface-wind information is key to determining how the oil will spread. Ocean scatterometer data could help clean-up and containment crews to minimize the environmental effects of such a disaster. Food Production - Perhaps the oldest use of the ocean is in the harvesting of food. Today, ocean fishing is a highly systematic activity that makes extensive use of advanced technology to reduce the cost and to increase the value of every catch. Detailed wind data from scatterometers can aid in the management of commercial seafood crops. The annual U.S. shrimp harvest in the Gulf of Mexico, for example, depends on favorable on-shore winds that help transport offshore plankton larvae to estuaries where the larvae can develop into adult shrimp. SeaWinds data can help fishermen monitor wind conditions during this critical phase in life of shrimp. back: Why is Scatterometry Important? |

Scatterometry |
|
Subscribe to the Earth Observatory About the Earth Observatory Contact Us Privacy Policy and Important Notices Responsible NASA Official: Lorraine A. Remer Webmaster: Goran Halusa We're a part of the Science Mission Directorate |
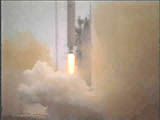
 NASA's Quick Scatterometer (QuikSCAT) was lofted into space
at 7:15 p.m. Pacific Daylight Time on Saturday, June 19, 1999 atop a U.S. Air
Force Titan II launch vehicle from Space Launch Complex 4 West at
California's Vandenberg Air Force Base. The satellite was launched in a
south-southwesterly direction, soaring over the Pacific Ocean at sunset
as it ascended into space to achieve an initial elliptical orbit with a
maximum altitude of about 800 kilometers (500 miles) above Earth's
surface.
NASA's Quick Scatterometer (QuikSCAT) was lofted into space
at 7:15 p.m. Pacific Daylight Time on Saturday, June 19, 1999 atop a U.S. Air
Force Titan II launch vehicle from Space Launch Complex 4 West at
California's Vandenberg Air Force Base. The satellite was launched in a
south-southwesterly direction, soaring over the Pacific Ocean at sunset
as it ascended into space to achieve an initial elliptical orbit with a
maximum altitude of about 800 kilometers (500 miles) above Earth's
surface.