|
||
|
|
||
 Mapping Earth's Diverse Landscapes
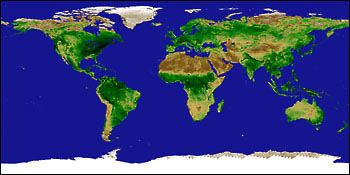
Nearly every aspect of our lives is tied into the vegetation and ground cover that surround us. Farms feed us, forests provide us with oxygen and building materials, rivers and lakes yield fresh water to drink, and cities shelter us. When land covers change, our health, economy, and environment can all be affected. Twenty-five years ago, for instance, thousands of people starved when the vegetation in the Sahel region of Africa dried up during an extended drought. In 1993, small town after small town had to be evacuated as the Mississippi River overflowed its banks and covered an area the size of Iowa in two feet of water. For years scientists across the world have been mapping these changes in the landscape to prevent future disasters, monitor natural resources, and collect information on the environment. While land cover can be observed on the ground or by airplane, the most efficient way to map it is from space. By using such imaging satellites as Landsat 5, Landsat 7 and Terra, scientists have the ability to observe large tracts of the Earth's surface in a fraction of the time needed to complete aerial or ground surveys. The data beamed back to Earth from these satellites can also be manipulated to highlight where one type of land cover begins and another ends. next: Mapping Earth's Diverse Landscapes The image at top shows landcover over one hemisphere, based on data from the University of Maryland Laboratory for Global Remote Sensing Studies Global Land Cover Project. Click the image to view the data in 3D and see a pallette that describes the landcover types. |
 Land Cover Classification Related Data Sets: Related Case Studies:
|
| How Scientists Differentiate Between Land Cover Types
Before scientists can transform raw satellite image data into land cover maps, they must decide on what categories of land cover they would like to use. Categories are simply the types of landscape that the scientists are trying to map and can vary greatly from map to map. For flood maps, there may be only two categories—dry land and wet land—while a standard global land cover map may have seventeen categories including closed shrub lands, savannas, evergreen needle leaf forest, urban areas, and ice/snow. The only requirement for any land cover category is that it have a distinct spectral signature that a satellite can record. As can
be seen through a prism, many different colors (wavelengths) make up the
spectra of sunlight. When sunlight strikes objects, certain wavelengths
are absorbed and others are reflected or emitted. The unique way in
which a given type of land cover reflects and absorbs light is known as
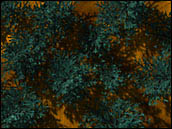
its spectral signature. Anyone who has flown over the midwestern United States has seen
evidence of this phenomenon. From an airplane window, the ground appears
as a patchwork of different colors formed by the fields of crops planted there.
The varying pigments of the leaves, the amount of foliage per square
foot, the age of the plants, and many other factors create this
tapestry. |
Land Cover Classification Related Data Sets: Related Case Studies:
| ||
 Most imaging satellites are sensitive to specific wavelengths of light, including infrared wavelengths that cannot be seen with the naked eye. Passive satellite remote sensors—such as those flown on Landsat 5, Landsat 7, and Terra—have a number of light detectors (photoreceptors) on board that measure the energy reflected or emitted by the Earth. One light detector records only the blue part of the spectrum coming off the Earth. Another observes all the yellow-green light and still another picks up on all the near-infrared light. The detectors scan the Earth's surface as the satellite travels in a circular orbit very nearly from pole-to-pole. To differentiate between types of land cover and their attributes, researchers manipulate the colors recorded by the satellite to get the combination of wavelengths that best distinguishes the spectral signature of the land cover they wish to identify. After an area of forest or water or grass is identified, they can outline the category on an easy-to-analyze, color-coded map. To verify their results, the scientists will often travel to the regions of interest and compare the results of the map with test sites on the ground. next: The Basic Vegetation Map
|
| The Basic Vegetation Map
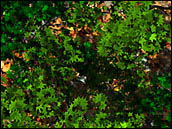
One of the most basic types of land cover maps is the vegetation map. This map shows a breakdown of general vegetation types over large areas of land, and typically contains over a dozen categories that include deciduous forest, broadleaf forest, farmland, and desert shrub. The physical processes behind the spectral signatures of green vegetation are well understood. Chlorophyll in plants absorbs red light and other visible wavelengths from the sun for use in photosynthesis. The cell structure in plant leaves generally reflects near-infrared light. The more foliage a plant has, the more these wavelengths of light will be absorbed and reflected.
To determine what type of vegetation exists over a given region, researchers take a satellite image of the infrared and red light emitted and reflected from a plot of land. They then compare the two types of light at each point (pixel) on the image. The difference in intensity between the two wavelengths tells them the density of vegetation present. If the difference is at its highest value, then the vegetation at that pixel is likely to be rather dense and may contain rain forest, for example. If it is at its lowest value, then the vegetation is probably sparse, which could be indicative of a desert. Defined values between these two extremes indicate other categories such as farmland. Once every pixel on a given image is accounted for, scientists can lay the pixels out on a map and color code the results. They then take periodic ground test measurements of the areas mapped to verify the exact type of vegetation there. next: The Problems in Uncovering Land Cover
|
Land Cover Classification Related Data Sets: Related Case Studies:
|
| The Problems in Uncovering Land Cover
Researchers have used remote sensing to map vegetation for years. The categories are often well defined and can be used for plots of land around the world. However, many categories scientists attempt to map are not so easy to discern from the satellite data. Frequently, the types of land cover a research group wishes to measure are too interspersed for the satellite to see. For example if a satellite has a resolution of 30 meters, it cannot distinguish any land features smaller than a 30x30-meter square. If two categories, such as parking lots and lawns, vary greatly over a plot of this size, the satellite will not be able to tell which percentage of each covers the land. Ground-based measurements and aerial photographs would have to be employed to get an accurate reading. |
Land Cover Classification Related Data Sets: Related Case Studies:
| ||
 |
Another challenge researchers face is in finding just the right color combinations of light to identify specific types of land cover, or information about these land covers. Unlike the example given above, there is usually no simple difference formula available to retrieve the categories from raw satellite images. For instance, in the Pacific Northwest, researchers from the Bureau of Land Management and the U.S. Forest Service are using Landsat 5 in an attempt to map the average size of trees throughout the conifer forests. The purpose of these maps is to help other scientists monitor old-growth forests there. Going into the project no one had a predefined method of manipulating the satellite images to give them a view of these attributes. To find the best color combination, researchers first had to travel into the field and determine the average size of trees over a number of forest test plots. They then acquired Landsat 5 images of these same test plots. All six reflected colors observed by Landsat 5 were mixed and matched and analyzed in a number of ways until the scientists found the combination of reflected wavelengths that accurately described the tree sizes on the test plots. With this template, they were then able to determine the size of trees on plots that had not been tested beforehand. In general, the more specific a category is, the more ground and airplane surveys are needed. However, even if researchers can only get by with mapping half of a given area with the satellite, it is usually far cheaper and much less time consuming than any other survey method. back: The Basic Vegetation Map
|
| |
Land Cover Classification Related Data Sets: Related Case Studies:
| |||
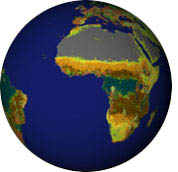
 The Quicktime Virtual Reality (QTVR) movie above shows landcover over
the entire globe—just click and drag on the globe to rotate it. It is based on data from the
University of Maryland Laboratory for Global Remote Sensing
Studies Global Land Cover Project. (To compare landcover to other data in the Earth Observatory,
go to the Observation Deck.) The Quicktime Virtual Reality (QTVR) movie above shows landcover over
the entire globe—just click and drag on the globe to rotate it. It is based on data from the
University of Maryland Laboratory for Global Remote Sensing
Studies Global Land Cover Project. (To compare landcover to other data in the Earth Observatory,
go to the Observation Deck.) | ||||
| next: Differentiating Between Land Cover Types back: Mapping Earth's Diverse Landscapes | ||||
|
Subscribe to the Earth Observatory About the Earth Observatory Contact Us Privacy Policy and Important Notices Responsible NASA Official: Lorraine A. Remer Webmaster: Goran Halusa We're a part of the Science Mission Directorate |