Event-Based
Science is a new way to teach middle
school science. It is an award-winning,
standards-based program in which
newsworthy events establish the relevance
of science topics; authentic tasks create
the need-to-know more about those topics;
and lively interviews, photographs, Web
pages, and inquiry-based science
activities create a desire to know more
about those topics.
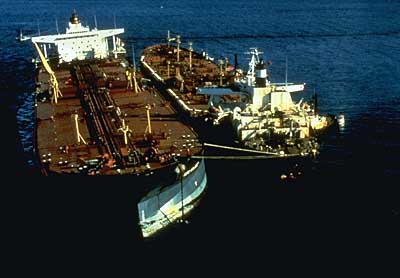
Oil
Spill! is an Event-Based Science
module about oceanography. It uses the
1989 spill of over 10 million gallons of
oil from the tanker Exxon Valdez to
establish the context for exploring
concepts related to shoreline
oceanography. The task in Oil
Spill! requires students to examine
competing sites for a new oil terminal.
Students acquire then use their new
knowledge of tides, currents, marine life,
and harbor topography to advise an oil
company.
As with all
Event-Based Science modules, much of the
information that students need is provided in the
pages of Oil Spill!. However, more
information is needed. Students need information
about the six cities that are being considered for
three terminal sites. They also need information
about booms and skimmers--the tools of the cleanup
industry.
Below are some
World-Wide Web sites where information is
available. Click on the highlighted words and be
linked with sites where helpful information can be
found.
5/3/99 (Austin,
TX) A wording problem has been found in the "When
Do We Sail, Captain?" Science Activity on page 22.
The offending wording is found in the right-hand
column and reads as follows: "..simply
add positive numbers and subtract negative numbers
from the charted depth."
The problem is that when negative numbers are
subtracted, the effect is similar to adding a
positive number. The correct wording should be:
"...simply
add the tide numbers to the charted depth; but
keep in mind that you may have to add negative
numbers."
Thanks to Dr.
Paul Myers (Associate Professor, Department of
Computer Science, Trinity University, San Antonio,
TX) for catching this error and providing the
correct wording.
Harbor
Photographs
The task in Oil
Spill! involves evaluating six different
harbors. Below are three photographs of the San
Diego Harbor. We are eager to post photographs of
San Francisco, Galveston, Pensacola, Charleston,
and Baltimore too. If you have photos of these
other harbors please call us (1-800-327-7252) to
arrange for adding your photos to this page. Click
on each image to view its full-size
version.
A "pdf" file containing web
sites, books, material lists, and correlations with
National Science Education Standards.
Use the
BACK button in your browser to return to
this page.
Links to Oil
Spill! related WEB Sites
(Links are checked monthly. They were working
on the day of the last update.)
Tide
PredictionsThis site allows you to calculate tidal
predictions for more than 3000 tide stations.
The list of stations has been broken down into
states and other areas for which there are tide
stations. Each state is further broken into
regions.
This site also provides access to
historical tide data.
Selecting
a Harbor: Oceanography and the Impact of Oil
Spills This
site provides an extensive elaboration of the
Event-Based Science Oil Spill! module.
Prepared for use by students at West Chicago
Middle School, West Chicago, IL. It was written
by Jill Mueller (miata@www.com) and Pat Pentek
(ppentek@inil.com) of West Chicago Middle
School. Created for The Fermilab LInC sponsored
by Fermi National Accelerator Laboratory
Education Office , and Friends of Fermilab, and
the Illinois State Board of Education.
Two exciting additions to Oil Spill! are
available at this site, a "job application form"
and a "job offer letter." You will find these
forms by following the link to student pages.
Use them to enhance the realness of Oil
Spill!.
National
Data Buoy Center
Near-real-time data from the last 72
hours are available on this server.
Links will lead you to an individual
station's page. There you will find
real-time meteorological and wave
observations (if that station is
currently active), detailed wave
summaries (for stations with active
wave gauges), and the latest National
Weather Service marine forecasts.
Historical data and information about
the station are also available from the
same page.
Station 44009 -
Southeast of Cape May, NJ Courtesy NOAA
How
Big is an Oil
Tanker?
This site contains an activity on
measuring an oil tanker, the size of
the Exxon Valdez. It gives students a
much better understanding of the size
of a typical oil tanker. In addition,
the students are asked to sketch a
scale drawing of a typical oil
tanker.
The EXXON VALDEZ ran aground
on Bligh Reef in Prince William Sound, Alaska on
March 24, 1989, spilling 10.8 million gallons of
oil into the marine environment. It is currently
#53 on the all-time list of largest oil spills.
NOAA
Oil
Spill Remediation Learn about
Petroleum Remediation Product (PRP) an
award-winning oil-spill cleaning powder.
Oil
Spill Cleanup
Equipment
Information about booms, skimmers,
and other cleanup equipment. This
information will be especially
helpful to the Risk Planner on your
team.
The
Official Exxon Valdez Oil Spill
Restoration Web
Site
This site is supported by the Exxon
Valdez Oil Spill Trustee Council and
provides information about the
impact of the oil spill, the status
of recovery of injured resources and
services and information about
ongoing restoration and
research.
Prince
William's Oily Mess: A Tale of Recovery A new
educational case study describing the impacts and recovery of
the 1989 Exxon Valdez oil spill in Alaska’s Prince William
Sound is now available from the National Oceanic and Atmospheric
Administration’s National Ocean Service. NOAA is an agency of
the U.S. Department of Commerce.
NOAA
Office of Response and Restoration
This site has
tools and information for emergency responders
and planners, and others working to understand
and mitigate the effects of oil and hazardous
materials in our waters and along our
coasts.
U.S.
Census Bureau
Maps and population information that will help
the Economist on your team.
The
Stowaway Adventure
This multidisciplinary Internet-based learning
experience has been designed to expose students
to real-world problem solving through unique
uses of instructional technologies. In
particular, students will use real-time data
from the Internet to track a real ship at sea,
determine its destination and predict when it
will arrive. In addition, they will have the
opportunity to monitor the weather conditions at
sea and predict when rough weather might impact
on the ship's arrival time. (This project is
developed and managed by the Center for
Improved Engineering and Science Education
(CIESE) which is located at Stevens Institute of
Technology in Hoboken, New
Jersey.)
The
Gulf Stream Voyage
is an online multidisciplinary project which
utilizes both real time data and primary source
materials to help guide students to discover the
science and history of the Gulf Stream. Students
will investigate the driving forces behind this
great ocean current, how it affects the Atlantic
Ocean and some of mankind's experiences dealing
with it. This voyage includes activities for
marine science, earth science, chemistry,
physics, biology, math, history and language
arts. All may be easily used in today's
technology enhanced classroom. (This project is
developed and managed by the Center for
Improved Engineering and Science Education
(CIESE) which is located at Stevens Institute of
Technology in Hoboken, New
Jersey.)
Tides
and Water LevelsAt this NOAA site, you will find
three sections devoted to learning about tides and water levels:
an online tutorial, an educational roadmap to resources, and
formal lesson plans.

 Oil
Spill! is an Event-Based Science
module about oceanography. It uses the
1989 spill of over 10 million gallons of
oil from the tanker Exxon Valdez to
establish the context for exploring
concepts related to shoreline
oceanography. The task in Oil
Spill! requires students to examine
competing sites for a new oil terminal.
Students acquire then use their new
knowledge of tides, currents, marine life,
and harbor topography to advise an oil
company.
Oil
Spill! is an Event-Based Science
module about oceanography. It uses the
1989 spill of over 10 million gallons of
oil from the tanker Exxon Valdez to
establish the context for exploring
concepts related to shoreline
oceanography. The task in Oil
Spill! requires students to examine
competing sites for a new oil terminal.
Students acquire then use their new
knowledge of tides, currents, marine life,
and harbor topography to advise an oil
company.