|
|
 |
You have accessed a U.S. Government Computer System.
Visitors are authorized to use this system to acquire MODIS-Atmosphere related data information, images, products, and services only.
Access to this system constitutes visitors consent to keystroke monitoring.
Any malicious action or intent on this system is prohibited and punishable under Federal Law.
Privacy Policy and Important Notices

Overview
One of the most important ecological issues concerning our planet is climate change.
It is generally agreed that the Earth's climate will modify
in response to radiative forcing induced by changes in atmospheric trace gases,
cloud cover, cloud type, solar radiation, and tropospheric aerosols
(liquid or solid particles suspended in the air).
In order to develop conceptual and predictive global climate models,
it is vital to monitor these properties.
Two MODIS (Moderate Resolution Imaging Spectroradiometer) instruments,
the first launched on 18 December 1999 onboard the Terra Platform
and the second on 4 May 2002 onboard the Aqua platform,
are uniquely designed (wide spectral range, high spatial resolution, and near daily global coverage)
to observe and monitor these and other Earth changes.
(MORE)
Feature L1B Granule Image

|
|
Record Breaking California Wildfires
On October 23rd 2007, the Terra-MODIS instrument captured this image of multiple wildfires and smoke driven by powerful Santa Ana winds in southern California.
The fires flared up over the previous weekend, when temperatures surged past 110 degrees in some parts of the state,
creating tinder-like conditions in areas already starved of water by an unusually dry winter.
The wildfires have forced nearly 1/2 a million people to evacuate their homes from San Diego to just north of Los Angeles.
Image by Ridgway & Hubanks, NASA GSFC.
More RGB images of MODIS granules can be found in the
L1B Granules section.
|
L1B & L2 Granule Case Study: Kamchatka Cloud Properties
|
|
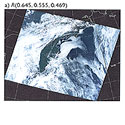
L1B RGB Composite
The RGB (MODIS bands 1:4:3) true-color composite for a single daytime granule of Terra-MODIS data over
the Western Pacific Ocean near the Kamchatka Peninsula (0025 UTC on 10 August 2001)
shows extensive cloud cover over the Sea of Okhotsk, including mid-level and upper-level ice clouds,
whereas the Bering Sea to the east of the Peninsula contains extensive marine stratocumulus clouds with numerous
ship tracks in the southeastern portion of the image.
|
|
|
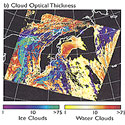
Cloud Optical Thickness
Cloud optical thickness (at 0.66 µm) derived for this granule
shows optically thick (values up to 25) marine stratocumulus
to the east of the Peninsula and identifies them as liquid water clouds.
The optically thick ice clouds over the Sea of Okhotsk and around the southern portion
of the Kamchatka Peninsula have cloud optical thicknesses approaching 40.
Note that two separate color bars were implemented to help visually differentiate clouds identified as
ice (violet-green) vs. liquid water (yellow-red), both scales cover the range 1-75.
|
|
|
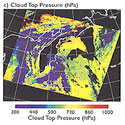
Cloud Top Pressure
Cloud top pressures derived for all cloud-filled pixels in the scene clearly show that liquid water clouds lie predominantly between
700 and 850-hPa, whereas the optically thick ice clouds over the Sea of Okhotsk lie at altitudes above the 500-hPa level.
Note that the scale used in the image ranges from 300-hPa (violet) to 1000-hPa (red).
|
|
|
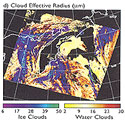
Cloud Effective Radius
This image shows cloud effective particle radius derived for cloudy pixels in the scene.
Separate color bars were used again here to differentiate cloud phase;
ice (violet-green, which covers the range 6-50) vs.
liquid water (yellow-red, which covers the range 2-30).
It is noteworthy that the ship tracks are not easily identified in the
cloud optical thickness image, above, but are visible in the cloud effective radius image
from the reduced effective radii in the microphysical retrievals.
For this scene, the thermal infrared and decision tree
algorithms for deriving cloud thermodynamic phase, discussed
by Platnick et al.,
are in quite good agreement.
[For more detail, see King et. al].
Images by Mark Gray, Dr. Steven Platnick, & Dr. Michael King.
More images of MODIS Atmosphere Level 2 products can be found in the
L2 Granules section.
|
L3 Global Imagery: Monthly Average Timeseries
|
|
Clear-sky Preciptable Water (IR)
This animation shows clear-sky total-column atmospheric water vapor (precipitable water) from November 2002 through June 2003.
The monthly average data, ranging from 0 (violet) to 7.5 cm (red), were derived using infrared (IR) retrieval techniques.
The seasonal migration of high vapor content in the inter-tropical convergence zone (ITCZ) is clearly visible.
|
|
|
Cloud Fraction (Daytime)
Monthly average daytime-only cloud fraction data from November 2002 through June 2003,
computed at 1-degree resolution using 5x5 1-km cloud mask data as input,
range from 0% (violet) to 100% (red).
Large scale Hadley cell circulations in the equatorial regions as well as
the stormy latitude bands between 40 and 60 degrees,
driven by dynamic global-scale thermal gradients, are clearly visible.
|
|
|
Aerosol Optical Depth
This animation depicts monthly average aerosol optical depth from November 2002 through June 2003.
The unit-less data, computed in daytime scenes only, range from 0.0 (violet) to 3.0 (red).
High-concentration aerosol plumes being transported over the Atlantic Ocean west of the Sahara and
over the Pacific Ocean northeast of the dust-producing deserts of China are clearly visible.
|
|
|
Cloud Optical Thickness (Water)
Monthly average cloud optical thickness for liquid water clouds from November 2002 through June 2003
are displayed on a log scale to help bring out detail.
The unit-less data values range from 1.0 (violet) to 10.0 (green) to 76.0 (red).
Optical thickness is a measure of the quanity of solar radiation allowed to travel through a column of atmosphere and
is an important new tool for helping scientists understand the role clouds play in the global climate system.
Red and yellow regions indicate very cloudy skies (on average), which reduces the solar radiation reaching the Earth's surface.
Green and light blue areas show moderately cloudy skies.
Dark blue to violet colors show regions where there is little or no cloud cover (on average),
and low attenuation of solar radiation from clouds.
Animations by Paul Hubanks.
A complete set of monthly global atmosphere images can be found in the
L3 Low-Res Monthly section.
|
|
|
|
|
Spotlight
|
|
Summary of C005 Known Data Problems (Issues) -
A Summary of all Collection 005 (C005) known data problems (issues) is now available.
Some of the issues also have PDF documents showing additional detail as well as example imagery.
[ Known Data Problems (Issues) ]
MODIS Data Processing Schedule and Calendar (Deep Blue Update) -
All MODIS data (both Terra and Aqua platforms) are now available in Collection 005.
A reprocessing of Aqua platform data (L2 Aerosol, L2 Joint, and L3 only) containing the Deep Blue Aerosol update has also begun.
View the calendar to follow the progress of the Deep Blue Aerosol reprocess (color coded with a darker blue shading).
[ CALENDAR ]
MODIS Level-1 and Atmosphere Archive and Distribution System (LAADS Web ) -
LAADS Web is the web interface to the Level-1 and Atmosphere Archive and Distribution System (LAADS).
The mission of LAADS is to provide quick and easy access to MODIS Level-1 and Atmosphere data products.
Through this interface, one can visually browse MODIS atmosphere products,
selected products may then be downloaded directly from the website or retrieved from the FTP site.
[ MORE ]
MODIS Collection 005 Change Summary -
The next generation of MODIS data products, tagged Collection 005, began production with the L2 Cloud Mask only in June 2005.
All other L2 Atmosphere products began production in January 2006. The L3 data will follow in February 2006.
Collection 005 MODIS data will be earmarked by significant improvements in almost every key data product (SDS parameter).
Summaries of Collection 005 code/product changes and science impacts for each MODIS data product family are in the process of being drafted.
[ MORE ]
MODIS Atmosphere QA Plan for Collection 005 -
A newly updated and improved version of the MODIS Atmosphere Quality Assurance (QA) Plan
has been completed. This plan documents Collection 005 related changes
to QA bit-flag arrays contained within all L2 MODIS Atmosphere products.
A number of corrections were also made to the previous version of the plan.
Improvements to this new version of the QA Plan include:
the inclusion of number of sample QA Flag images,
a primer on reading (decoding) QA flags,
improved documentation on interpreting the meaning of various QA flags,
a detailed explanation of Inventory and Archive Metadata structures,
along with sample data values and reference images.
[ VIEW ]
MODIS Online Visualization and Analysis System (MOVAS) -
This new and powerful web-based MODIS data analysis tool
is designed for visualization and analysis of the Terra / MODIS Level-3 Atmosphere Monthly global product (MOD08_M3).
Users can plot area average (area plot) and time series (time plot) or generate ASCII output for selected area and time period.
Spatial coverage is 90°S - 90°N, spatial resolution is 1° x 1°, and temporal resolution is monthly.
[ MORE ]
L2 Joint Atmosphere Product -
A compact L2 product containing the "greatest hits" of MODIS-Atmosphere science parameters began production on October 14th 2003.
The first available data days are julian days 285 (10/12/03) for Aqua and 286 (10/13/03) for Terra.
[ MORE ]
Near Real-time MODIS L1B Images -
View near-real time RGB mapped images of all daytime MODIS granules
from either the Terra (February 2000 to current)
or Aqua (June 2002 to current) platforms.
[ TERRA ]
[ AQUA ]
Near Real-time Monthly Global Images -
View monthly global images of the full set of L3 MODIS Atmosphere products
from either the Terra (March 2000 to current)
or Aqua (July 2002 to current) platforms.
[ TERRA ]
[ AQUA ]
|
|
|
|
|

