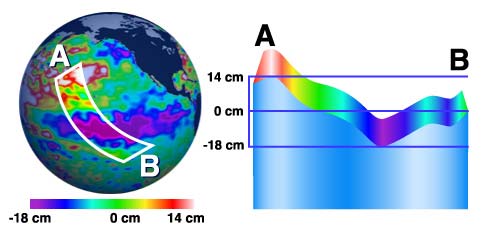
What is sea-surface height?
 The height (or "relief") of the sea surface is caused by both
gravity (which doesn't change much over 100's of years), and the active
(always changing) ocean circulation. The normal slow, regular circulation
(ocean current) patterns of sea-surface height move up and down (warming
and cooling and wind forcing) with the normal progression of the seasons ... winter to spring
to summer to fall. Using theory of ocean dynamics, TOPEX/Poseidon and Jason sea-surface heights
can be used to calculate how much heat is stored in the ocean below. The
year-to-year and, even, decade-to-decade changes in the ocean that indicate
climate events such as the El Niño, La Niña and Pacific Decadal Oscillation
are dramatically visualized by these data. Sea-surface height is the most
modern and powerful tool for taking the "pulse" of the
global oceans.
The height (or "relief") of the sea surface is caused by both
gravity (which doesn't change much over 100's of years), and the active
(always changing) ocean circulation. The normal slow, regular circulation
(ocean current) patterns of sea-surface height move up and down (warming
and cooling and wind forcing) with the normal progression of the seasons ... winter to spring
to summer to fall. Using theory of ocean dynamics, TOPEX/Poseidon and Jason sea-surface heights
can be used to calculate how much heat is stored in the ocean below. The
year-to-year and, even, decade-to-decade changes in the ocean that indicate
climate events such as the El Niño, La Niña and Pacific Decadal Oscillation
are dramatically visualized by these data. Sea-surface height is the most
modern and powerful tool for taking the "pulse" of the
global oceans.
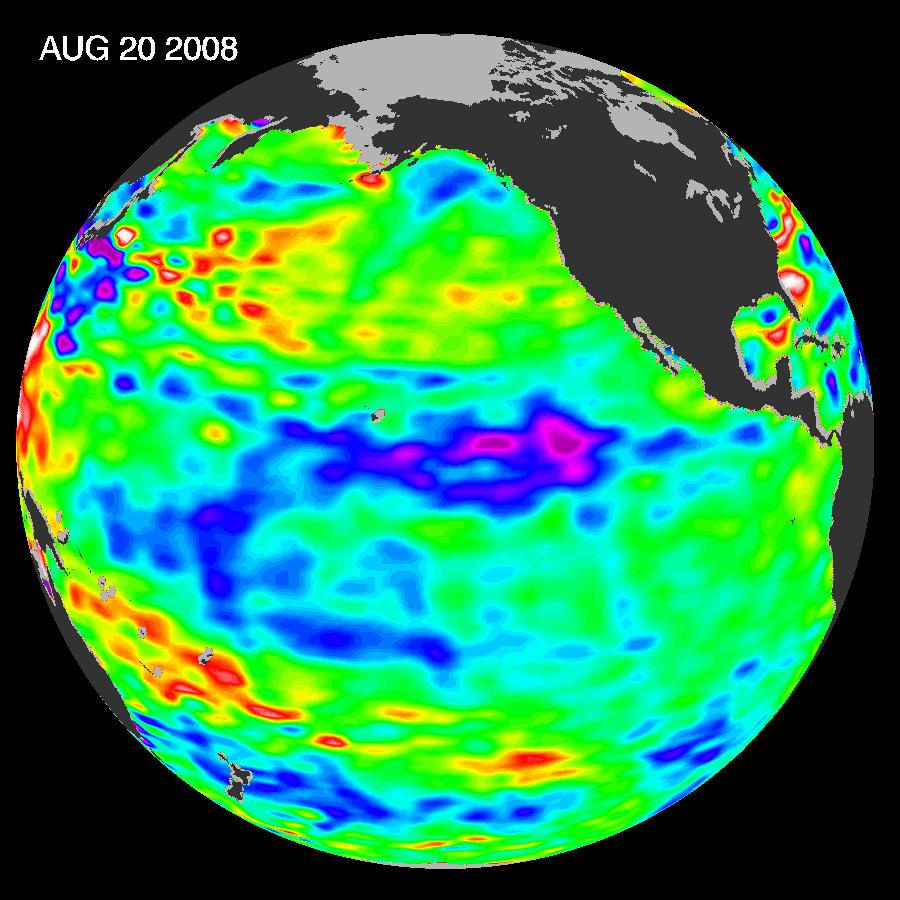
What are we looking at?
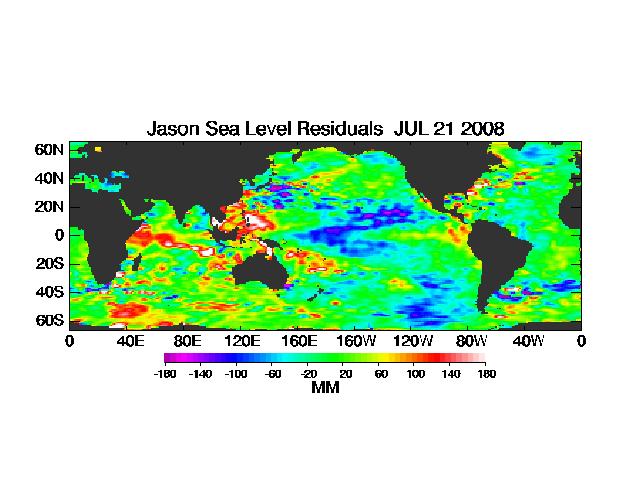
These images show sea surface height anomalies with the seasonal cycle
(the effects of summer, fall, winter, and spring) removed. The differences between
what we see and what is normal for different times and regions are called
anomalies, or residuals. When oceanographers and climatologists view these
"anomalies" they can identify unusual patterns and can tell us
how heat is being stored in the ocean to influence future planetary climate events.
Each image is a 10-day average of data, centered on the date indicated.
For additional information visit: