September 2005
ADR IN THE PRE-COMPLAINT STAGE
ADR IN THE FORMAL COMPLAINT STAGE
As a central piece of its Five-Point Plan, the Equal Employment Opportunity Commission (EEOC) seeks to promote and expand the use of alternative dispute resolution (ADR) in an effort to resolve equal employment opportunity (EEO) disputes. In Part I of its ADR Study, the EEOC examines ADR in the pre-complaint and formal complaint stages of the federal sector EEO process. This report evaluates the government-wide data, as submitted by the federal agencies, to determine how effectively ADR programs resolved EEO disputes and how efficiently the ADR programs operated. In addition, this report addresses other important ADR issues, including types of ADR techniques, sources of neutrals, and types of settlement benefits.
During the pre-complaint stage in fiscal year (FY) 2003, ADR was used in 42% of all instances of EEO counseling, which is an increase from 23% in FY 2002. This increase was due, in large part, to an ADR offer rate that climbed from 47% in FY 2002 to 73% in FY 2003. In FY 2004, the participation rate rose to 43% and the offer rate rose to 80%. The vast majority of ADR attempts utilized mediation as the ADR technique and neutrals from private organizations as the source of mediators. Since FY 2000, ADR has averaged a resolution rate of 58% in the pre-complaint stage. In FY 2003, ADR efforts resulted in 7,168 settlements, totaling $1,384,474 in monetary benefits. In FY 2004, ADR efforts resulted in 6,427 settlements, totaling $1,609,404 in monetary benefits.
During the formal complaint stage in FY 2003, there was a slight increase in ADR usage from 4% in FY 2002 to 7% in FY 2003; however, the usage slipped to 3% in FY 2004. The low ADR participation rate may be attributed to an offer rate of only 7% in FY 2004, which represents a decrease from 12% in FY 2003. Similar to the pre-complaint stage, agencies selected mediation and neutrals from private organizations in the majority of ADR attempts. With regard to the ADR attempts that were completed in the formal complaint stage, the ADR resolution rate declined from 59% in FY 2002 to 42% in FY 2003, but increased significantly in FY 2004 to 77%. Since FY 2000, ADR has averaged a resolution rate of nearly 60% in the formal complaint stage. In FY 2003, ADR efforts resulted in 1,375 settlements, totaling $6,027,764 in monetary benefits. In FY 2004, ADR efforts resulted in 1,250 settlements, totaling $3,145,890 in monetary benefits.
Cari M. Dominguez, Chair of the U.S. Equal Employment Opportunity Commission (EEOC or Commission), has initiated the Five-Point Plan, a strategic framework to improve EEOC's overall operations.1 The centerpiece of the Plan is to promote and expand the use of mediation and other types of alternative dispute resolution (ADR) as a means of resolving equal employment opportunity (EEO) disputes.2 When used properly, ADR can provide parties with fast and cost-effective results by allowing them to avoid the time and expense of litigation. While at the same time, ADR can provide significant intangible benefits to the parties by repairing their working relationships and improving workplace communication and morale.3 In furtherance of the Plan's promotion of ADR, the Commission established a government-wide goal that fifty percent of all instances of EEO counseling utilize ADR by FY 2009. To achieve this goal, the Plan includes a broad, progressive approach which encourages the Commission to seek partnerships to enhance the effectiveness of federal agencies' programs and services.
To expand the use of ADR in the federal sector, the EEOC initiated a project to partner with twenty-one (21) federal agencies to identify best practices, provide technical assistance, and develop strategic plans to improve the quality and effectiveness of the agencies' ADR programs.4 Due to the scope of the ADR Study, the ADR report will be issued in two separate parts: Part I focuses on the efficiency and effectiveness of ADR in the EEO process; and Part II will discuss best practices of the partner agencies' ADR programs.
In Part I of its ADR Study, the Commission examines the efficiency and effectiveness of ADR in the pre-complaint and formal complaint stages of the federal sector EEO process. The Commission also evaluates the government-wide data, as reported by federal agencies in their annual form 462 submission to the Commission, to determine how successfully ADR programs resolved EEO disputes (effectiveness) and whether the ADR programs operated in a timely manner (efficiency). In addition, this report addresses other important ADR issues, including types of ADR techniques, sources of neutrals, and types of settlement benefits.
ADR Plays Key Role in the Federal Sector EEO Process
The EEOC was established by Title VII of the Civil Rights Act of 1964 with a mission of eradicating discrimination in the workplace. EEOC's regulations, 29 C.F.R.§ 1614.603, require agencies to make reasonable efforts to voluntarily settle EEO discrimination complaints as early as possible in, and throughout, the administrative process. The Administrative Dispute Resolution Act of 1996 (ADRA) requires each federal agency to adopt and promote the use of ADR. Since FY 2000, EEOC's regulations have required all federal agencies to establish or make available an ADR program during both the pre-complaint and formal complaint stages of the EEO process. The EEOC has made ADR the centerpiece of its Five-Point Plan to improve the EEO process. In this regard, the requirements for ADR programs in the federal sector EEO complaint process are outlined in 29 C.F.R. § 1614.102(b)(2) (1999), EEO Management Directive 110 (MD-110), and EEO Management Directive 715 (MD-715).
EEOC Implements Model EEO Program Guidelines
To fulfill its Five-Point Plan, the EEOC issued MD-715 in FY 2003, which provides policy guidance for establishing a model EEO program. To become a model EEO program under MD- 715, agencies must operate their EEO programs efficiently and take proactive steps to prevent unlawful discrimination from occurring. Agencies are required, among other things, to maintain an efficient, fair, and impartial complaint resolution process. An integral part of establishing a model EEO program is the effective use of ADR to resolve disputes.
All Federal Agencies Have An ADR Program
In FY 2003, 93 out of 94 (99%) agencies reported to the EEOC that they had established or made available an ADR program in their EEO complaint process.5 Eighty-four of those agencies reported that 100% of their workforce had access to the ADR program during FY 2003. Another six agencies reported that less than 100% of their workforce had access to an ADR program; all but one of those agencies have made ADR available to at least 91% of their total workforce. Three agencies could not provide the size of their workforce due to national security reasons.6 By FY 2004, all agencies with more than 100 employees had established or made an ADR program available.
Agencies have the discretion to determine when an EEO matter is appropriate for ADR. They may establish written procedures to identify when ADR will be offered, or they may decide to offer ADR on a case-by-case basis. Agencies may not decline to offer ADR to particular cases solely because of the basis involved (i.e., race, color, religion, national origin, sex, age, disability, or retaliation).
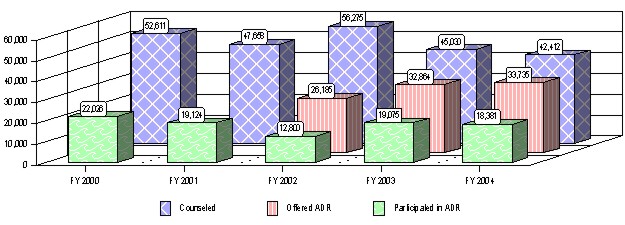
During the pre-complaint process in FY 2003, individuals sought counseling from an EEO Counselor or an ADR Intake Officer in 45,030 matters. Agencies offered ADR to individuals in 32,864 instances of counseling (73%). Of the total instances of counseling, 19,075 (42%) agreed to participate and were accepted into the agency's ADR program.
During the pre-complaint process in FY 2004, individuals sought counseling from an EEO Counselor or an ADR Intake Officer in 42,412 matters. Agencies offered ADR to individuals in 33,735 instances of counseling (80%). Of the total instances of counseling, 18,381 (43%) agreed to participate and were accepted into the agency's ADR program.
The EEOC has established a goal that the parties should participate in ADR in 50% of all instances of counseling. Since FY 2000, the ADR participation rate during the pre-complaint stage has averaged 38%. A three-year analysis of the data shows that the ADR participation rate in the pre-complaint process increased by 19 percentage points from 23% in FY 2002 to 42% in FY 2003 and to 43% in FY 2004. The higher ADR participation rate may be due to an ADR offer rate that climbed from 47% in FY 2002 to 73% in FY 2003 to 80% in FY 2004. Because higher offer rates may produce higher participation rates, we recommend that agencies strive to increase their offer rate to at least 75% of all instances of counseling.
Figure 1 - ADR Usage in the Pre-Complaint Process7
FYs 2000 - 2004
Because the U.S. Postal Service reported 19,101 (45%) out of the 42,412 instances of counseling in FY 2004, the government-wide data is largely impacted by that agency. When the FY 2004 government-wide data is examined excluding the U.S. Postal Service, the ADR offer rate decreased from 80% to 62%, and the ADR participation rate decreased significantly from 43% to 20%. A two-year analysis of the data, excluding the U.S. Postal Service, shows that the ADR participation rate increased by 4 percentage points from 16% in FY 2003 to 20% in FY 2004. Since FY 2000, the ADR participation rate during the pre-complaint stage has averaged 21% excluding the U.S. Postal Service.
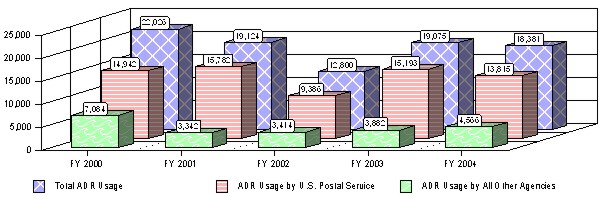
Figure 2 - Comparison of ADR Usage Between U.S. Postal Service
and All Other Agencies in the Pre-Complaint Process
FYs 2000 - 2004
In FY 2003, the Defense Logistics Agency and the four other agencies listed in Table 1, below, reported the highest ADR offer rate among federal agencies. The ADR offer rate is obtained by dividing the number of ADR offers by the total number of instances of counseling.8 A table with the complete ranking of agencies by ADR offer rate is located at www.eeoc.gov/federal/adr/datatables/index.html. In FY 2004, seven agencies with at least 125 completed counselings had offer rates of 100%. The agencies are listed in Table 1a.
Table 1 - Highest ADR Offer Rate in the Pre-Complaint Process 9
FY 2003
| Agencies | Counselings | ADR Offers | Offer Rate |
|---|---|---|---|
| Defense Logistics Agency | 518 | 519 | 100% |
| Army & Air Force Exchange Service | 397 | 397 | 100% |
| Department of Labor | 229 | 238 | 100% |
| General Services Administration | 167 | 189 | 100% |
| National Aeronautics and Space Administration | 174 | 174 | 100% |
Table 1a - Highest ADR Offer Rate in the Pre-Complaint Process
FY 2004
| Agencies | Counselings | ADR Offers | Offer Rate |
|---|---|---|---|
| U.S. Postal Service | 19,101 | 19,248 | 100% |
| Defense Logistics Agency | 482 | 502 | 100% |
| Defense Army and Air Force Exchange | 309 | 309 | 100% |
| Department of Labor | 221 | 241 | 100% |
| Defense Finance and Accounting Service | 184 | 202 | 100% |
| Broadcasting Board of Governors | 149 | 157 | 100% |
| Environmental Protection Agency | 125 | 125 | 100% |
In FY 2003, the Government Printing Office and the Federal Trade Commission tied for the most improved ADR offer rate in the pre-complaint process. The most improved ADR offer rate is determined by subtracting the ADR offer rate for FY 2002 from the offer rate for FY 2003.
Table 2 - Most Improved ADR Offer Rate in the Pre-Complaint Process
FYs 2002 - 2003
| Agencies | Offer Rate | Increase in ADR Offers | |
|---|---|---|---|
| FY 2002 | FY 2003 | ||
| Government Printing Office | 0% | 100% | 100% |
| Federal Trade Commission | 0% | 100% | 100% |
| Defense National Security Agency | 6% | 92% | 86% |
| National Aeronautics and Space Administration | 34% | 100% | 66% |
| U.S. Postal Service | 46% | 97% | 51% |
In FY 2004, two agencies tied for the most improved ADR offer rate in the pre-complaint process. The most improved ADR offer rate is determined by subtracting the ADR offer rate for FY 2003 from the offer rate of FY 2004.
Table 2a - Most Improved ADR Offer Rate in the Pre-Complaint Process
FYs 2003 - 2004
| Agencies | Offer Rate | Increase in ADR Offers | |
|---|---|---|---|
| FY 2003 | FY 2004 | ||
| Defense Finance & Accounting Service | 0% | 100% | 100% |
| Department of Education | 0% | 100% | 100% |
| Federal Communications Commission | 7% | 100% | 93% |
| Broadcasting Board of Governors | 12% | 100% | 88% |
| Export-Import Bank | 6% | 83% | 77% |
In FY 2003, the Tennessee Valley Authority had the largest decline in its ADR offer rate in the pre-complaint process. The largest decline in ADR offer rate is determined by subtracting the ADR offer rate for FY 2003 from the offer rate in FY 2002.
Table 3 - Largest Decline in ADR Offer Rate in the Pre-Complaint Process
FYs 2002 - 2003
| Agencies | Offer Rate | Decrease in ADR Offers | |
|---|---|---|---|
| FY 2002 | FY 2003 | ||
| Tennessee Valley Authority | 50% | 8% | -42% |
| Department of the Navy | 42% | 15% | -27% |
| Department of Energy | 84% | 57% | -27% |
| Department of Commerce | 89% | 67% | -22% |
| Federal Deposit Insurance Corporation | 89% | 71% | -18% |
Table 3a - Largest Decline in ADR Offer Rate in the Pre-Complaint Process
FYs 2003-2004
| Agencies | Offer Rate | Decrease in ADR Offers | |
|---|---|---|---|
| FY 2003 | FY 2004 | ||
| Defense Office of Inspector General | 100% | 8% | -92% |
| Nuclear Regulatory Commission | 100% | 15% | -85% |
| Pension Benefit Guaranty Corporation | 43% | 0% | -43% |
| National Science Foundation | 100% | 71% | -29% |
| General Services Administration | 100% | 80% | -20% |
In FY 2003, the U.S. Postal Service reported the highest ADR participation rate in the pre- complaint process. The ADR participation rate is obtained by dividing the number of cases processed in ADR by the total number of instances of counseling. A table with the complete ranking of agencies by ADR participation rate is located at www.eeoc.gov/federal/adr/datatables/index.html.
Table 4 - Highest ADR Participation Rate in the Pre-Complaint Process
FY 2003
| Agencies | Counselings | Participation in ADR | Participation Rate |
|---|---|---|---|
| U.S. Postal Service | 20,102 | 15,193 | 76% |
| National Archives & Records Administration | 35 | 16 | 46% |
| National Aeronautics & Space Administration | 174 | 78 | 45% |
| National Imagery & Mapping Agency | 56 | 18 | 32% |
| Department of Transportation | 607 | 184 | 30% |
In FY 2004, the U.S. Postal Service repeated having the highest ADR participation rate in the pre-complaint process.
Table 4a - Highest ADR Participation Rate in the Pre-Complaint Process
FY 2004
| Agencies | Counselings | Participation in ADR | Participation Rate |
|---|---|---|---|
| U.S. Postal Service | 19,101 | 13,815 | 72% |
| Smithsonian Institution | 36 | 17 | 47% |
| Defense Dependent Education Activity | 112 | 52 | 46% |
| Federal Deposit Insurance Corporation | 53 | 22 | 42% |
| National Archives and Records Administration | 53 | 22 | 42% |
In FY 2003, the U.S. Postal Service had the most improved ADR participation rate in the pre- complaint process. The most improved ADR participation rate is determined by subtracting the ADR participation rate in FY 2002 from the participation rate in FY 2003.
Table 5 - Most Improved ADR Participation Rate in the Pre-Complaint Process
FYs 2002 - 2003
| Agencies | Participation Rate | Increase in ADR Participation | |
|---|---|---|---|
| FY 2002 | FY 2003 | ||
| U.S. Postal Service | 32% | 76% | 44% |
| National Aeronautics and Space Administration | 12% | 45% | 33% |
| Smithsonian Institute | 0% | 24% | 24% |
| National Archives & Records Administration | 27% | 46% | 19% |
| Department of Transportation | 17% | 30% | 13% |
In FY 2004, the Defense Dependent Education Activity had the most improved ADR participation rate in the pre-complaint process. The most improved ADR participation rate is determined by subtracting the ADR participation rate in FY 2003 from the participation rate in FY 2004.
Table 5a - Most Improved ADR Participation Rate in the Pre-Complaint Process
FYs 2003 - 2004
| Agencies | Participation Rate | Increase in ADR Participation | |
|---|---|---|---|
| FY 2003 | FY 2004 | ||
| Defense Dependent Education Activity | 4% | 46% | 42% |
| Consumer Product Safety Commission | 25% | 60% | 35% |
| Court Services and Offender Supervision | 20% | 50% | 30% |
| Smithsonian Institution | 24% | 47% | 23% |
| Defense Intelligence Agency | 18% | 40% | 22% |
In FY 2003, the Department of State had the largest decline in ADR participation rate in the pre- complaint process. The largest decline in ADR participation rate is determined by subtracting the ADR participation rate in FY 2003 from the participation rate in FY 2002.
Table 6 - Largest Decline in ADR Participation Rate in the Pre-Complaint Process
FYs 2002 - 2003
| Agencies | Participation Rate | Decrease in ADR Participation | |
|---|---|---|---|
| FY 2002 | FY 2003 | ||
| Department of State | 31% | 12% | -19% |
| Department of the Navy | 17% | 2% | -15% |
| Department of Justice | 15% | 5% | -10% |
| Defense Army & Air Force Exchange Service | 19% | 13% | -6% |
| Department of Energy | 14% | 11% | -3% |
In FY 2004, NASA had the largest decline in ADR participation rate in the pre-complaint process. The largest decline in ADR participation rate is determined by subtracting the ADR participation rate in FY 2004 from the participation rate in FY 2003.
Table 6a - Largest Decline in ADR Participation Rate in the Pre-Complaint Process
FYs 2003 - 2004
| Agencies | Participation Rate | Decrease in ADR Participation | |
|---|---|---|---|
| FY 2003 | FY 2004 | ||
| National Aeronautics and Space Administration | 45% | 8% | -37% |
| Defense Office Of Inspector General | 25% | 0% | -25% |
| Defense Office of the Secretary | 21% | 2% | -19% |
| Securities & Exchange Commission | 33% | 15% | -18% |
| Department of Labor | 25% | 11% | -14% |
Federal agencies have flexibility in selecting the types of ADR techniques to use in their respective ADR programs. Agencies may consider their mission and their workplace culture to determine which ADR techniques will best meet the needs of their workforce.
In FY 2003, agencies reported 15,870 ADR attempts during the pre-complaint process. 10 Mediation was selected in nearly 96% of all instances of counseling in which ADR was attempted. Since FY 2000, mediation has been the overwhelming choice of ADR techniques, averaging 96% of all ADR attempts.
Table 7 - ADR Attempts During the Pre-Complaint Process FY 2003
| Types of ADR Attempts | Counselings | Percentage |
|---|---|---|
| Mediation | 15,222 | 95.92% |
| Facilitation | 298 | 1.88% |
| Settlement Conference | 128 | 0.81% |
| Multiple Techniques | 104 | 0.66% |
| Fact Finding | 52 | 0.33% |
| Other Techniques | 32 | 0.20% |
| Early Neutral Evaluation | 24 | 0.15% |
| Ombuds | 8 | 0.05% |
| Peer Review | 2 | 0.01% |
| Total ADR Attempts | 15,870 | 100.00% |
In FY 2004, agencies reported 10,714 ADR attempts during the pre-complaint process. Mediation was selected in 95% of all instances of counseling in which ADR was attempted in FY 2004.
Table 7a - ADR Attempts During the Pre-Complaint Process FY 2004
| Types of ADR Attempts | Counselings | Percentage |
|---|---|---|
| Mediation | 10,196 | 95.17% |
| Facilitation | 288 | 2.69% |
| Settlement Conference | 44 | 0.41% |
| Multiple Techniques | 80 | 0.75% |
| Fact Finding | 58 | 0.54% |
| Other Techniques | 12 | 0.11% |
| Early Neutral Evaluation | 18 | 0.17% |
| Ombuds | 14 | 0.13% |
| Peer Review | 4 | 0.03% |
| Total ADR Attempts | 10,714 | 100.00% |
Because the U.S. Postal Service reported 12,434 out of the 15,870 ADR attempts in FY 2003, the government-wide data is largely impacted by that agency. Even excluding the U.S. Postal Service data, however, mediation was the preeminent ADR technique during the pre-complaint process in FY 2003, as it was utilized in 82% of all ADR attempts as shown in Table 8. Table 8a shows the FY 2004 impact.
Table 8 - ADR Attempts in the Pre-Complaint Process
(Excluding the U.S. Postal Service)
FY 2003
| Types of ADR Attempts | Counselings | Percentage |
|---|---|---|
| Mediation | 2,807 | 81.69% |
| Facilitation | 288 | 8.38% |
| Settlement Conference | 128 | 3.73% |
| Multiple Techniques | 104 | 3.03% |
| Fact Finding | 52 | 1.51% |
| Other Techniques | 32 | 0.93% |
| Early Neutral Evaluation | 15 | 0.44% |
| Ombuds | 8 | 0.23% |
| Peer Review | 2 | 0.06% |
| Total ADR Attempts | 3,436 | 100.00% |
Table 8a - ADR Attempts in the Pre-Complaint Process
(Excluding the U.S. Postal Service)
FY 2004
| Types of ADR Attempts | Counselings | Percentage |
|---|---|---|
| Mediation | 3,214 | 86.14% |
| Facilitation | 288 | 7.72% |
| Settlement Conference | 44 | 1.18% |
| Multiple Techniques | 79 | 2.12% |
| Fact Finding | 58 | 1.55% |
| Other Techniques | 12 | 0.32% |
| Early Neutral Evaluation | 18 | 0.48% |
| Ombuds | 14 | 0.38% |
| Peer Review | 4 | 0.11% |
| Total ADR Attempts | 3,731 | 100.00% |
The maximum time allowed for ADR during the pre-complaint process is 90 days. 29 C.F.R. §1614.105(f). A three-year analysis of the data shows that the average time for ADR attempts during the pre-complaint process increased from 36 days in FY 2002 to 46 days in FY 2004. These processing times, however, remain well within the 90-day maximum allowed for ADR.
Table 9 - Average Time By ADR Attempts
in the Pre-Complaint Process
11
FYs 2002 - 2004
| ADR Techniques | Average Time Per Technique | ||
|---|---|---|---|
| FY 2002 | FY 2003 | FY 2004 | |
| Mediation | 36 days | 34 days | 46 days |
| Facilitation | 27 days | 62 days | 50 days |
| Settlement Conference | 23 days | 33 days | 38 days |
| Multiple Techniques | 14 days | 33 days | 39 days |
| Fact Finding | 25 days | 27 days | 26 days |
| Other Techniques | 61 days | 28 days | 31 days |
| Early Neutral Evaluation | 18 days | 43 days | 8 days |
| Ombuds | 20 days | 75 days | 8 days |
| Peer Review | 30 days | 38 days | 39 days |
| Total ADR Attempts | 36 days | 34 days | 46 days |
The Administrative Dispute Resolution Act defines a neutral as an individual who, with respect to an issue in controversy, functions specifically to aid the parties in resolving the controversy.12 In the federal sector, ADR programs have the discretion to select the source(s) of neutrals to conduct ADR proceedings.
Federal sector ADR programs selected neutrals from the following sources: (1) in-house (employees within the agency trained in ADR); (2) another federal agency; (3) private organizations; (4) multiple sources; and (5) other sources.
Government-wide data shows that in FY 2003, neutrals from private organizations (including bar associations, individual volunteers, and contractors) were selected more often than any other source of neutrals. A three-year analysis of the data shows that the percentage of neutrals from private organizations increased from 70% in FY 2002 to 79% in FY 2003. The percentage decreased to 65% in FY 2004. Since FY 2000, neutrals from private organizations have averaged 73% of all ADR attempts.
Figure 3 - Sources of Neutrals in the Pre-Complaint Process FY 2003
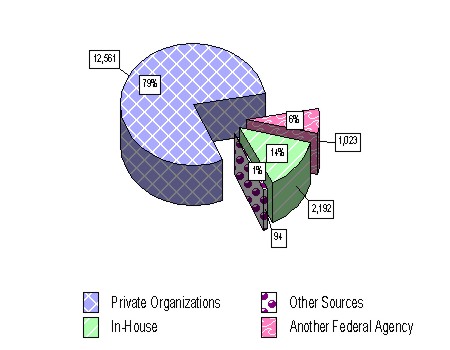
Figure 3a - Sources of Neutrals in the Pre-Complaint Process FY 2004
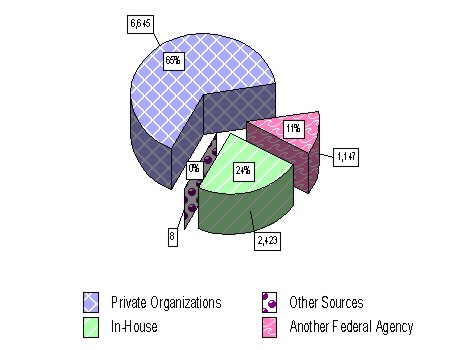
The U.S. Postal Service exclusively used private organizations in 12,434 (78%) out of the 15,870 government-wide total instances of counseling that attempted ADR in FY 2003, and in 6,982 (65%) out of the 10,714 total instances of counselings that attempted ADR in FY 2004. When the U.S. Postal Service data is excluded from the number of ADR attempts, federal agencies selected in-house neutrals more frequently than any other source of neutrals in FY 2003 and FY 2004.
A three-year analysis of the data shows that the use of in-house neutrals decreased from 67% in FY 2002 to 63% in FY 2003 and to 59% in FY 2004. Since FY 2000, the use of in-house neutrals has declined each year; however, it remains the primary source of neutrals, averaging 69% of all ADR attempts over the past 5 years (excluding U.S. Postal Service data).
Figure 4 - Sources of Neutrals in the Pre-Complaint Process (Excluding the U.S. Postal Service) FY 2003
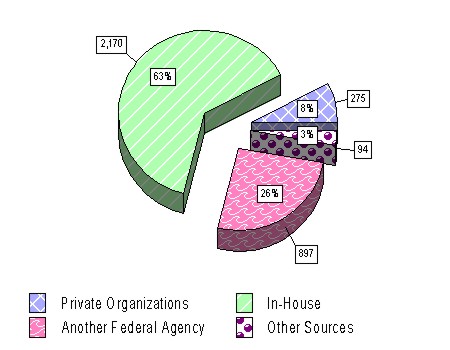
Figure 4a - Sources of Neutrals in the Pre-Complaint Process
(Excluding the U.S. Postal Service)
FY 2004

One factor in determining the effectiveness of ADR in the federal sector EEO process is the percentage of EEO disputes that are resolved each fiscal year.13 Of the 17,216 ADR closures during the pre-complaint process in FY 2004, the ADR process resulted in 8,391 (49%) resolutions.14 A three-year analysis of the data shows that the ADR resolution rate decreased from 62% in FY 2002 to 60% in FY 2003 to 49% in FY 2004. The ADR resolution rate has declined from 63% to 49% in FY 2004; however, the ADR resolution rate has averaged 58% over the five-year period.
Figure 5 - Trends in ADR Resolutions During the Pre-Complaint Process FYs 2000 - 2004
In FY 2003, the Federal Emergency Management Agency (FEMA) had the highest ADR resolution rate in the pre-complaint process. The ADR resolution rate is obtained by dividing the number of ADR resolutions by the number of ADR closures. A table with the complete ranking of agencies by ADR resolution rate is located at www.eeoc.gov/federal/adr/datatables/index.html.
Table 10 - Highest ADR Resolution Rates During the Pre-Complaint Process
FY 2003
| Agencies | ADR Closures | ADR Resolutions | Resolution Rate |
|---|---|---|---|
| Federal Emergency Management Agency | 16 | 16 | 100% |
| Defense National Guard Bureau | 36 | 33 | 92% |
| Defense Logistics Agency | 58 | 49 | 84% |
| National Archives & Records Administration | 22 | 18 | 82% |
| Department of the Army | 326 | 254 | 78% |
In FY 2004, the Defense Dependent Education Activity had the highest ADR resolution rate in the pre-complaint process. Department of Veterans Affairs also moved into the top five.
Table 10a - Highest ADR Resolution Rates During the Pre-Complaint Process
FY 2004
| Agencies | ADR Closures | ADR Resolutions | Resolution Rate |
|---|---|---|---|
| Defense Dependent Education Activity | 52 | 52 | 100% |
| Defense Logistics Agency | 77 | 65 | 84% |
| Department of Veterans Affairs | 448 | 355 | 79% |
| National Archives and Records Administration | 20 | 15 | 75% |
| Defense National Guard Bureau | 18 | 13 | 72% |
In FY 2003, the National Aeronautics and Space Administration had the most improved ADR resolution rate in the pre-complaint process. The most improved ADR resolution rate is determined by subtracting the ADR resolution rate for FY 2002 from the resolution rate for FY 2003.
Table 11 - Most Improved ADR Resolution Rate in the Pre-Complaint Process
FYs 2002 - 2003
| Agencies | Resolution Rate | Increase in Resolution Rate | |
|---|---|---|---|
| FY 2002 | FY 2003 | ||
| National Aeronautics and Space Administration | 20% | 61% | 41% |
| Department of the Interior | 34% | 71% | 37% |
| Department of Agriculture | 17% | 52% | 35% |
| Department of the Army | 53% | 78% | 25% |
| Federal Emergency Management Agency | 75% | 100% | 25% |
In FY 2004, the Department of Education had the most improved ADR resolution rate in the pre- complaint process. Defense Finance and Accounting Service had the second highest rate increase with a 60% increase.
Table 11a - Most Improved ADR Resolution Rate in the Pre-Complaint Process
FYs 2003 - 2004
| Agencies | Resolution Rate | Increase in Resolution Rate | |
|---|---|---|---|
| FY 2003 | FY 2004 | ||
| Department of Education | 0% | 100% | 100% |
| Defense Finance and Accounting Service | 0% | 60% | 60% |
| General Services Administration | 41% | 68% | 27% |
| Department of Veterans Affairs | 59% | 79% | 20% |
| Department of Housing and Urban Development | 37% | 54% | 17% |
In FY 2003, the Department of Labor had the largest decline in ADR resolution rate in the pre- complaint process. The largest decline in ADR resolution rate is determined by subtracting the ADR resolution rate in FY 2003 from the resolution rate in FY 2002.
Table 12 - Largest Decline in ADR Resolution Rate in the Pre-Complaint Process
FYs 2002 - 2003
| Agencies | Resolution Rate | Decrease in Resolution Rate | |
|---|---|---|---|
| FY 2002 | FY 2003 | ||
| Department of Labor | 82% | 31% | -51% |
| Department of Commerce | 81% | 33% | -48% |
| Department of State | 81% | 37% | -44% |
| Small Business Administration | 100% | 67% | -33% |
| Defense Commissary Agency | 89% | 59% | -30% |
In FY 2004, the Department of the Navy had the largest decline in ADR resolution rate in the pre-complaint process. The largest decline in ADR resolution rate is determined by subtracting the ADR resolution rate in FY 2004 from the resolution rate in FY 2003.
Table 12a - Largest Decline in ADR Resolution Rate in the Pre-Complaint Process
FYs 2003 - 2004
| Agencies | Resolution Rate | Decrease in Resolution Rate | |
|---|---|---|---|
| FY 2003 | FY 2004 | ||
| Department of the Navy | 76% | 23% | -53% |
| Smithsonian Institution | 70% | 35% | -35% |
| Department of Health and Human Services | 75% | 43% | -32% |
| Department of Transportation | 67% | 36% | -31% |
| Small Business Administration | 67% | 46% | -21% |
A three-year analysis of the data shows that the average processing time (APT) for ADR closures during the pre-complaint process increased from 38 days in FY 2002 to 39 days in FY 2003 to 61 days in FY 2004. Table 13 shows the average processing time in FY 2003 and Table 13a shows the average processing time in FY 2004.16
Table 13 - Average Processing Time in the Pre-Complaint Process FY 2003
| Types of ADR Closure | ADR Closures | Total Days | Average Processing Time |
|---|---|---|---|
| Settlement | 7,168 | 276,218 | 39 days |
| No Resolution | 6,020 | 234,093 | 39 days |
| No Complaint Filed | 4,461 | 175,435 | 39 days |
| No ADR Attempt* | 1,708 | 66,830 | 39 days |
| Other Closures | 25 | 330 | 13 days |
| Total ADR Closures | 19,382 | 752,906 | 39 days |
* "No ADR Attempt" means that the both parties agreed to participate in ADR, but one of the parties withdrew from the ADR process prior to the ADR attempt.
Table 13a- Average Processing Time in the Pre-Complaint Process
FY 2004
| Types of ADR Closure | ADR Closures | Total Days | Average Processing Time |
|---|---|---|---|
| Settlement | 6,427 | 342,898 | 53 days |
| No Resolution | 3,154 | 165,192 | 52 days |
| No Complaint Filed | 1,964 | 111,958 | 57 days |
| No ADR Attempt | 4,970 | 392,341 | 79 days |
| Other Closures | 701 | 35,751 | 51 days |
| Total ADR Closures | 17,216 | 1,048,140 | 61 |
In FY 2003, as shown in Table 14, the National Guard Bureau had the fastest average processing time (APT) for ADR closures in the pre-complaint process. In FY 2004, Defense Logistics Agency had the fastest APT, as shown in Table 14a. The government-wide average in FY 2004 is 61 days. If two or more agencies have the same average processing time, the agency with the most ADR closures was given the highest ranking.
Table 14 - Fastest Average Processing Time in the Pre-Complaint Process
FY 2003
| Agencies | ADR Closures (Counselings) | Total Days For ADR Closures | Average Processing Time |
|---|---|---|---|
| National Guard Bureau | 36 | 525 | 15 days |
| Department of Transportation | 203 | 4,342 | 21 days |
| Social Security Administration | 97 | 2,752 | 28 days |
| Department of Agriculture | 276 | 8,731 | 32 days |
| Department of the Interior | 31 | 1,006 | 32 days |
Table 14a - Fastest Average Processing Time in the Pre-Complaint Process
FY 2004
| Agencies | ADR Closures (Counselings) | Total Days For ADR Closures | Average Processing Time |
|---|---|---|---|
| Defense Logistics Agency | 77 | 1,461 | 19 days |
| Defense National Guard Bureau | 18 | 425 | 24 days |
| Defense Dependent Education Activity | 52 | 1,299 | 25 days |
| Defense Finance and Accounting Service | 20 | 561 | 28 days |
| Defense National Geospatial- Intelligence Agency | 12 | 374 | 31 days |
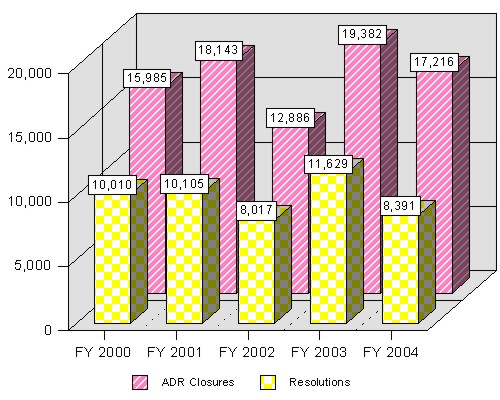
Of the 45,030 instances of counseling that were completed in FY 2003, 28,011 (62%) were resolved through EEO Counseling or ADR, including a total of 8,298 settlements.17 In FY 2004, there were 42,412 instances of counseling and 21,520 (51%) were resolved through EEO Counseling or ADR, including a total of 8,332 settlements. A three-year analysis of the data shows that the total resolution rate increased by one percentage point, climbing from 61% in FY 2002 to 62% in FY 2003 but dropped 10 percentage points in FY 2004 to 52% which is 1% above the total resolution rate in FY 2001.
Table 15 - Comparison of Pre-Complaint Resolutions
FYs 2000 - 2004
| Fiscal Year | Completed Counselings | Settlements | No Formal Complaint | Total Resolutions | |||||
|---|---|---|---|---|---|---|---|---|---|
| Total | ADR | EEO Counseling | ADR | EEO Counseling | ADR | EEO Counseling | ADR | EEO Counseling | |
| 2000 | 52,611 | 15,985 | 36,626 | 7,056 | 7,162 | 2,954 | 10,915 | 10,010 | 18,077 |
| 2001 | 47,658 | 18,143 | 29,515 | 8,318 | 3,632 | 1,787 | 10,620 | 10,105 | 14,252 |
| 2002 | 56,275 | 12,886 | 43,389 | 5,888 | 3,162 | 2,129 | 23,151 | 8,017 | 26,313 |
| 2003 | 45,030 | 19,382 | 25,648 | 7,168 | 1,130 | 4,461 | 15,252 | 11,629 | 16,382 |
| 2004 | 42,412 | 17,216 | 25,196 | 6,427 | 1,905 | 1,964 | 11,700 | 8,391 | 13,605 |
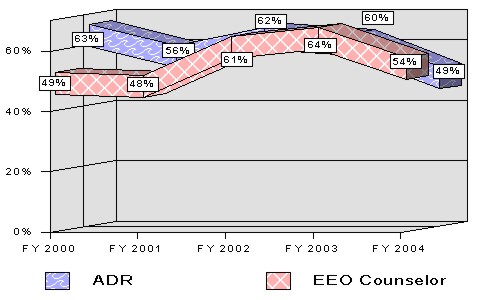
From FY 2000 to FY 2004, ADR has averaged a resolution rate of 58%, while EEO counseling has averaged a resolution rate of 53%. In FY 2003, the EEO counseling resolution rate (64%) exceeded the ADR resolution rate (60%). In FY 2004, the EEO counseling resolution rate (54%) continued to exceed the ADR resolution rate (49%).
Figure 6 - Trends in Resolution Rates During the Pre-Complaint Process FYs 2000 - 2004
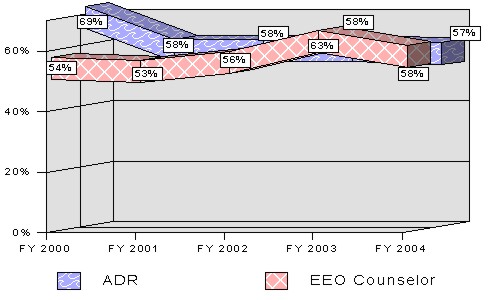
Because the U.S. Postal Service reported 12,595 out of the 17,216 ADR closures in FY 2004, the government-wide data is largely impacted by that agency. When the U.S. Postal Service is excluded from the government-wide data, the resolution rate in FY 2004 declined for ADR (from 58% to 57%) and the resolution rate for EEO counseling decreased (from 63% to 58%).
Figure 7 - Trends in Resolution Rates During the Pre-Complaint Process (Excluding the U.S. Postal Service) FYs 2000 - 2004
The types of monetary benefits reported were: (1) compensatory damages; (2) back pay/front pay; (3) lump sum; (4) attorney's fees; and (5) other monetary benefits. The types of non- monetary benefits reported were: (1) new hire; (2) promotion; (3) reinstatement; (4) expungement of records; (5) transfer; (6) rescind removal/voluntary resignation; (7) reasonable accommodation; and (8) other non-monetary benefits.
During the pre-complaint process in FY 2004, 8,332 instances of counseling were resolved through settlement agreements, either with the use of ADR or traditional EEO counseling. In particular, 9,008 18 settlements were resolved with non-monetary benefits, and 603 settlements were resolved with monetary benefits, totaling $3,137,911. In FY 2004, the amount of monetary benefits in pre-complaint settlements averaged $5,204 per case. Over the last three fiscal years, the total amount of monetary benefits in pre-complaint settlements averaged $4,925 per case.
Table 16 - Comparison of Pre-Complaint Monetary Benefits 19
FYs 2001 - 2004
| Fiscal Year | Monetary Settlements (Counselings) | Monetary Benefits | Average Monetary Benefits | ||||||
|---|---|---|---|---|---|---|---|---|---|
| Total | ADR | EEO Counseling | Total | ADR | EEO Counseling | Total | ADR | EEO Counseling | |
| 2001 | 983 | 692 | 291 | $4,470,855 | $2,331,867 | $2,138,988 | $4,548 | $3,370 | $7,350 |
| 2002 | 568 | 435 | 133 | $2,527,538 | $1,942,638 | $584,900 | $4,450 | $4,466 | $4,398 |
| 2003 | 621 | 464 | 157 | $3,160,565 | $1,384,474 | $1,776,091 | $5,089 | $2,984 | $11,313 |
| 2004 | 603 | 416 | 187 | $3,137,911 | $1,609,404 | $1,528,507 | $5,204 | $3,896 | $8,174 |
During the pre-complaint process in FY 2003, ADR efforts resulted in 7,168 settlements, including 464 with monetary benefits totaling $1,384,474, and EEO counseling resulted in 1,130 settlements, including 157 with monetary benefits totaling $1,776,091. Although more ADR settlements were reported in FY 2003 than in the previous fiscal year, the total amount of ADR settlements decreased by $558,164. As a result, the average amount of monetary benefits for ADR settlements declined to $2,984 in FY 2003. With regard to settlements through EEO counseling, both the number and amount of settlements increased in FY 2003. By contrast, the average for EEO counseling settlements increased substantially to $11,313 in FY 2003. Over the last three fiscal years,20 the average amount of monetary benefits was $3,607 for ADR settlements, while the average for EEO counseling settlements was $7,687.
The table below shows that in FY 2003, the lump sum payment was the most frequently used type of monetary settlement benefit. Compensatory damages had the highest average of monetary benefits.
Table 17 - Monetary Benefits in the Pre-Complaint Process 21
FY 2003
| Types of Monetary Benefits | Counselings | Total Monetary Benefits | Average Amount | |||
|---|---|---|---|---|---|---|
| ADR | EEO Counseling | ADR | EEO Counseling | ADR | EEO Counseling | |
| Lump Sum | 189 | 76 | $725,696 | $1,084,809 | $3,840 | $14,274 |
| Back Pay/Front Pay | 136 | 25 | $179,090 | $228,532 | $1,317 | $9,141 |
| Other Benefits | 65 | 26 | $99,923 | $35,203 | $1,537 | $1,354 |
| Attorney's Fees | 63 | 17 | $223,284 | $88,173 | $3,544 | $5,187 |
| Compensatory Damages | 29 | 13 | $156,481 | $339,374 | $5,396 | $26,106 |
| Total Monetary Benefits | 464 | 157 | $1,384,474 | $1,776,091 | $2,984 | $11,313 |
During the pre-complaint process in FY 2004, ADR efforts resulted in 6,427 settlements, including 416 with monetary benefits totaling $1,609,404, and EEO counseling resulted in 1,905 settlements, including 187 with monetary benefits totaling $1,528,507. Although fewer ADR settlements were reported in FY 2004 than in the previous fiscal year, the total amount of ADR settlements increased by $224,930. With regard to settlements through EEO counseling, the number of settlements increased while the amount of settlements through EEO counseling decreased in FY 2004. As a result, the average amount of monetary benefits for ADR settlements increased to $3,869 in FY 2004. By contrast, the average for EEO counseling settlements decreased substantially to $8,174 in FY 2004. Over the last four fiscal years, the average amount of monetary benefits for ADR settlements was $3,673, while the average for EEO counseling settlements was $7,809.
The table below shows that in FY 2004, the lump sum payment was the most frequently used type of monetary settlement benefit. Compensatory damages had the highest average of monetary benefits.
Table 17 a - Monetary Benefits in the Pre-Complaint Process 22
FY 2004
| Types of Monetary Benefits | Counselings | Total Monetary Benefits | Average Amount | |||
|---|---|---|---|---|---|---|
| ADR | EEO Counseling | ADR | EEO Counseling | ADR | EEO Counseling | |
| Lump Sum | 149 | 92 | $780,650 | $590,503 | $5,239 | $6,419 |
| Back Pay/Front Pay | 113 | 29 | $272,792 | $78,824 | $2,414 | $2,718 |
| Other Benefits | 55 | 19 | $92,939 | $35,048 | $1,690 | $1,845 |
| Attorney's Fees | 65 | 33 | $215,428 | $259,780 | $3,314 | $7,872 |
| Compensatory Damages | 45 | 17 | $247,596 | $294,352 | $5,502 | $17,315 |
| Total Monetary Benefits | 416 | 187 | $1,609,404 | $1,528,507 | $3,869 | $8,174 |
During the pre-complaint process in FY 2003, ADR efforts resulted in 7,168 settlements, including 6,779 with non-monetary benefits, and EEO counseling resulted in 1,130 settlements, including 973 with non-monetary benefits.
The table below shows that in FY 2003, "other non-monetary benefits" was the category most frequently reported, appearing in 66% of the ADR settlements and 33% of the EEO counseling settlements. Examples of other non-monetary benefits include a modified appraisal rating, an updated position description, priority consideration, a detail, a desk audit, leave restored/modified, a neutral reference, and a reassignment of duties.
Table 18 - Non-Monetary Benefits in the Pre-Complaint Process 23
FY 2003
| Types of Non-Monetary Benefits | Completed Counselings | |
|---|---|---|
| ADR | EEO Counseling | |
| Other Non-Monetary Benefits | 4,505 | 320 |
| Expungement of Records | 808 | 93 |
| Reasonable Accommodation | 401 | 53 |
| Training | 400 | 122 |
| Apology | 236 | 134 |
| Removal Rescinded/Voluntary Resignation | 169 | 69 |
| Transfer | 153 | 101 |
| Promotion | 93 | 45 |
| Reinstatement | 90 | 16 |
| New Hire | 36 | 20 |
| Total Non-Monetary Benefits | 6,779 | 973 |
During the pre-complaint process in FY 2004, ADR efforts resulted in 6,427 settlements, including 5,978 with non-monetary benefits, and EEO counseling resulted in 1,905 settlements, including 1,515 with non-monetary benefits.
The table below shows that in FY 2004, "other non-monetary benefits" was the category most frequently reported, appearing in 80% of the ADR settlements and 51% of the EEO counseling settlements.
Table 18 a - Non-Monetary Benefits in the Pre-Complaint Process 24
FY 2004
| Types of Non-Monetary Benefits | Completed Counselings | |
|---|---|---|
| ADR | EEO Counseling | |
| Other Non-Monetary Benefits | 4,800 | 768 |
| Expungement of Records | 272 | 159 |
| Reasonable Accommodation | 203 | 112 |
| Training | 223 | 165 |
| Apology | 449 | 160 |
| Removal Rescinded/Voluntary Resignation | 160 | 65 |
| Transfer | 186 | 114 |
| Promotion | 89 | 56 |
| Reinstatement | 50 | 25 |
| New Hire | 60 | 14 |
| Total Non-Monetary Benefits | 5,978 | 1,515 |
Agencies are required by EEOC regulations to have an ADR program available for both the pre- complaint and formal complaint processes. However, they have the discretion to determine when an EEO matter is appropriate for ADR, and at what point in the EEO process to offer ADR. They may establish written procedures to identify when ADR will be offered, or they may decide to offer ADR on a case-by-case basis.
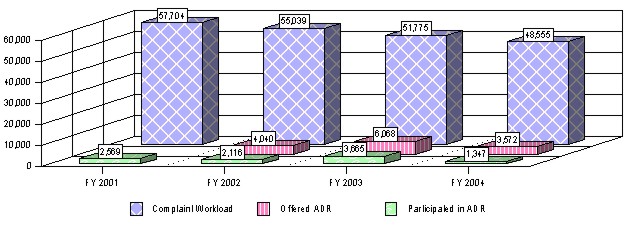
In FY 2003, 20,226 formal complaints were filed. When the number of complaints filed (20,226) is combined with complaints pending from the previous fiscal year (30,725) and complaints remanded for investigation (824), there was a complaint workload of 51,775. Agencies offered ADR to individuals in 6,068 complaints (12%). Of the total complaint workload, 3,665 (7%) agreed to participate and were accepted into the agency's ADR program.
In FY 2004, 19,024 formal complaints were filed. When the number of complaints filed (19,024) is combined with complaints pending from the previous fiscal year (29,250) and complaints remanded for investigation (281), there was a complaint workload of 48,555. Agencies offered ADR to individuals in 3,572 complaints (7.36%). Of the total complaint workload, 1,347 (2.77%) agreed to participate and were accepted into the agency's ADR program. The data below shows that ADR is significantly under-utilized at the formal complaint stage of the EEO process, due in large part to agencies' failure to offer ADR once a formal complaint has been filed.
A three-year analysis of the data shows that the ADR participation rate during the formal complaint stage increased from 4% in FY 2002 to 7% in FY 2003 but decreased to 2.77% in FY 2004. Since FY 2001, the ADR participation rate has averaged merely 4.44% of the complaint workload.
Figure 8 - ADR Usage in the Formal Complaint Process 25 FYs 2001 - 2004
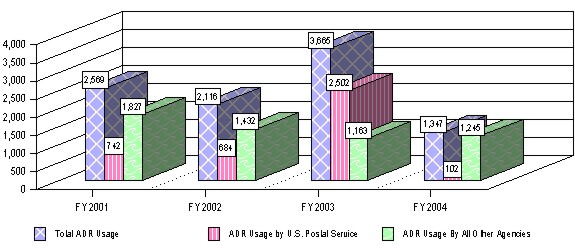
Because the U.S. Postal reported 18,748 (38.6%) out of the 48,555 complaint workload in FY 2004, the government-wide data is largely impacted by that agency. When the FY 2004 data is examined excluding the U.S. Postal Service, the ADR offer rate at the formal complaint stage increased from 7.36% to 11.3%, and the ADR participation rate increased from 2.77% to 4.18%. Despite an increase in the ADR offer rate from 7% in FY 2002 to 7.36% in FY 2004, the ADR participation rate decreased statistically from over 4% in FY 2002 to less than 3% in FY 2004.
Figure 9 - Comparison of ADR Usage Between U.S. Postal Service
and All Other Agencies in the Formal Complaint Process
FYs 2001 - 2004
In FY 2003, the National Imagery & Mapping Agency, now known as Defense National Geospatial-Intelligence Agency had the highest ADR offer rate in the formal complaint process. The ADR offer rate is obtained by dividing the number ADR offers by the number of the complaint workload. A table with the complete ranking of agencies by ADR offer rate is located at www.eeoc.gov/federal/adr/datatables/index.html.
Table 19 - Highest ADR Offer Rate in the Formal Complaint Process
FY 2003
| Agencies | Complaint Workload | ADR Offers | Offer Rate |
|---|---|---|---|
| National Imagery & Mapping Agency | 35 | 24 | 69% |
| National Gallery of Art | 21 | 13 | 62% |
| Department of the Air Force | 1,297 | 589 | 45% |
| Defense Commissary Agency | 368 | 141 | 38% |
| National Aeronautics and Space Administration | 132 | 50 | 38% |
In FY 2004, the National Gallery of Art had the highest ADR offer rate in the formal complaint process moving to the top from its second position in FY 2003.
Table 19a - Highest ADR Offer Rate in the Formal Complaint Process
FY 2004
| Agencies | Complaint Workload | ADR Offers | Offer Rate |
|---|---|---|---|
| National Gallery of Art | 18 | 11 | 61% |
| Broadcasting Board of Governors | 49 | 24 | 49% |
| Defense Commissary Agency | 353 | 148 | 42% |
| Central Intelligence Agency | 40 | 15 | 38% |
| Defense Information Systems Agency | 34 | 13 | 38% |
In FY 2003, the National Imagery & Mapping Agency had the most improved ADR offer rate in the formal complaint stage. The most improved ADR offer rate is determined by subtracting the ADR offer rate for FY 2002 from the offer rate for FY 2003.
Table 20 - Most Improved ADR Offer Rate in the Formal Complaint Process
FYs 2002 - 2003
| Agencies | Offer Rate | Increase in ADR Offers | |
|---|---|---|---|
| FY 2002 | FY 2003 | ||
| National Imagery & Mapping Agency | 31% | 69% | 38% |
| Broadcasting Board of Governors | 1% | 34% | 33% |
| Defense Commissary Agency | 7% | 38% | 31% |
| National Labor Relations Board | 4% | 20% | 16% |
| Department of the Interior | 2% | 15% | 13% |
In FY 2004, the Central Intelligence Agency had the most improved ADR offer rate in the formal complaint stage. The most improved ADR offer rate is determined by subtracting the ADR offer rate for FY 2003 from the offer rate for FY 2004.
Table 20a - Most Improved ADR Offer Rate in the Formal Complaint Process
FYs 2003 - 2004
| Agencies | Offer Rate | Increase in ADR Offers | |
|---|---|---|---|
| FY 2003 | FY 2004 | ||
| Central Intelligence Agency | 0% | 38% | 38% |
| Environmental Protection Agency | 4% | 31% | 27% |
| Defense Information Systems Agency | 13% | 38% | 25% |
| Defense National Guard Bureau | 19% | 34% | 15% |
| Broadcasting Board of Governors | 34% | 49% | 15% |
In FY 2003, the Department of the Air Force had the largest decline in ADR offer rate in the formal complaint process. The largest decline in ADR offer rate is determined by subtracting the ADR offer rate for FY 2003 from the offer rate for FY 2002.
Table 21 - Largest Decline in ADR Offer Rate in the Formal Complaint Process
FYs 2002 - 2003
| Agencies | Offer Rate | Decrease in ADR Offers | |
|---|---|---|---|
| FY 2002 | FY 2003 | ||
| Department of the Air Force | 64% | 45% | -19% |
| Department of Commerce | 18% | 3% | -15% |
| Department of Health & Human Services | 14% | 6% | -8% |
| Defense Army &a,p; Air Force Exchange Service | 25% | 18% | -7% |
| National Gallery of Art | 67% | 62% | -5% |
In FY 2004, the Defense National Geospatial-Intelligence had the largest decline in ADR offer rate in the formal complaint process.
Table 21a - Largest Decline in ADR Offer Rate in the Formal Complaint Process
FYs 2003 - 2004
| Agencies | Offer Rate | Decrease in ADR Offers | |
|---|---|---|---|
| FY 2003 | FY 2004 | ||
| Defense National Geospatial-Intelligence Agency | 69% | 14% | -55% |
| Department of the Air Force | 45% | 25% | -20% |
| United States Postal Service | 15% | 1% | -14% |
| National Aeronautics and Space Administration | 38% | 27% | -11% |
| Department of the Interior | 15% | 5% | -10% |
In FY 2003, the Defense Commissary Agency had the highest ADR participation rate in the formal complaint process. The ADR participation rate is obtained by dividing the number cases processed in ADR by the number of the complaint workload. A table with the complete ranking of agencies by ADR offer rate is located at www.eeoc.gov/federal/adr/datatables/index.html.
Table 22 - Highest ADR Participation Rate in the Formal Complaint Process
FY 2003
| Agencies | Complaints Workload | Participation in ADR | Participation Rate |
|---|---|---|---|
| Defense Commissary Agency | 368 | 66 | 18% |
| National Aeronautics and Space Administration | 132 | 18 | 14% |
| Equal Employment Opportunity Commission | 99 | 13 | 13% |
| U.S. Postal Service | 19,809 | 2,502 | 13% |
| Department of the Army | 2,267 | 276 | 12% |
In FY 2004, the Smithsonian Institution and Department of Education had the highest ADR participation rate in the formal complaint process.
Table 22a - Highest ADR Participation Rate in the Formal Complaint Process
FY 2004
| Agencies | Complaints Workload | Participation in ADR | Participation Rate |
|---|---|---|---|
| Smithsonian Institution | 353 | 84 | 24% |
| Department of Education | 121 | 29 | 24% |
| National Archives and Records Administration | 306 | 55 | 18% |
| National Labor Relations Board | 34 | 6 | 18% |
| Defense Office of the Inspector General | 1,399 | 204 | 15% |
In FY 2003, the Defense Commissary Agency had the most improved ADR participation rate in the formal complaint process. The most improved ADR participation rate is determined by subtracting the ADR participation rate for FY 2002 from the participation rate for FY 2003.
Table 23 - Most Improved ADR Participation Rate in the Formal Complaint Process
FYs 2002 - 2003
| Agencies | Participation Rate | Increase in ADR Participation | |
|---|---|---|---|
| FY 2002 | FY 2003 | ||
| Defense Commissary Agency | 6% | 18% | 12% |
| U.S. Postal Service | 3% | 13% | 10% |
| Equal Employment Opportunity Commission | 6% | 13% | 7% |
| Department of the Interior | 2% | 7% | 5% |
| Defense Contract Management Agency | 1% | 6% | 5% |
In FY 2004, the Department of Education had the most improved ADR participation rate in the formal complaint process. The most improved ADR participation rate is determined by subtracting the ADR participation rate for FY 2003 from the participation rate for FY 2004.
Table 23a - Most Improved ADR Participation Rate in the Formal Complaint Process
FYs 2003 - 2004
| Agencies | Participation Rate | Increase in ADR Participation | |
|---|---|---|---|
| FY 2003 | FY 2004 | ||
| Department of Education | 0% | 24% | 24% |
| Smithsonian Institution | 2% | 24% | 22% |
| National Labor Relations Board | 2% | 18% | 16% |
| National Archives and Records Administration | 3% | 18% | 15% |
| Federal Election Commission | 0% | 14% | 14% |
In FY 2003, the National Aeronautics and Space Administration had the largest decline in ADR participation rate in the formal complaint process. The largest decline in ADR participation rate is determined by subtracting the ADR participation rate for FY 2003 from the participation rate for FY 2003.
Table 24 - Largest Decline in ADR Participation Rate
in the Formal Complaint Process
FYs 2002 - 2003
| Agencies | Participation Rate | Decrease in ADR Participation | |
|---|---|---|---|
| FY 2002 | FY 2003 | ||
| National Aeronautics and Space Administration | 22% | 14% | -8% |
| Department of the Air Force | 15% | 11% | -4% |
| Department of Agriculture | 6% | 2% | -4% |
| Department of Justice | 4% | 1% | -3% |
| Department of Labor | 9% | 6% | -3% |
In FY 2004, the Defense Commissary Agency had the largest decline in ADR participation rate in the formal complaint process. The largest decline in ADR participation rate is determined by subtracting the ADR participation rate for FY 2004 from the participation rate for FY 2003.
Table 24a - Largest Decline in ADR Participation Rate
in the Formal Complaint Process
FYs 2003 - 2004
| Agencies | Participation Rate | Decrease in ADR Participation | |
|---|---|---|---|
| FY 2003 | FY 2004 | ||
| Defense Commissary Agency | 18% | 5% | -13% |
| National Gallery of Art | 10% | 1% | -9% |
| United States Postal Service | 13% | 5% | -8% |
| Defense Information Systems Agency | 10% | 5% | -5% |
Federal agencies have flexibility in selecting the types of ADR techniques to use in their respective ADR programs. Agencies may consider their mission and their workplace culture to determine which ADR techniques will best meet the needs of their workforce.
In FY 2003, agencies reported 3,293 ADR attempts during the formal complaint process. Mediation was selected in 85% of all formal complaints which attempted ADR in FY 2003. The use of mediations in ADR attempts increased by 12 percentage points, climbing from 73% in FY 2002 to 85% in FY 2003.
Table 25 - ADR Attempts in the Formal Complaint Process
FY 2003
| ADR Attempts | Complaints | Percentage |
|---|---|---|
| Mediation | 2,804 | 85.15% |
| Settlement Conference | 331 | 10.05% |
| Facilitation | 74 | 2.25% |
| Fact Finding | 56 | 1.70% |
| Multiple Techniques | 14 | 0.43% |
| Minitrial | 6 | 0.18% |
| Early Neutral Evaluation | 5 | 0.15% |
| Ombuds | 2 | 0.06% |
| Other Techniques | 1 | 0.03% |
| Total ADR Attempts | 3,293 | 100.00% |
In FY 2004, agencies reported 2,202 ADR attempts during the formal complaint process. Mediation was selected in 90% of all formal complaints which attempted ADR in FY 2004. The use of mediation in ADR attempts increased by five percentage points, climbing from 85% in FY 2003 to 90% in FY 2004. Since FY 2000, mediation has been used more than any other ADR technique at the formal complaint stage of the EEO process, averaging 79% of all ADR attempts.
Table 25a - ADR Attempts in the Formal Complaint Process
FY 2004
| ADR Attempts | Complaints | Percentage |
|---|---|---|
| Mediation | 1,977 | 89.78% |
| Settlement Conference | 123 | 5.59% |
| Facilitation | 59 | 2.68% |
| Fact Finding | 15 | 0.68% |
| Multiple Techniques | 23 | 1.04% |
| Minitrial | 0 | 0.00% |
| Early Neutral Evaluation | 3 | 0.14% |
| Ombuds | 2 | 0.09% |
| Other Techniques | 0 | 0.00% |
| Total ADR Attempts | 2,202 | 100.00% |
Because the U.S. Postal Service reported 2,109 out of the 3,293 ADR attempts during the formal complaint process in FY 2003, the government-wide data is largely impacted by that agency. Even excluding the U.S. Postal Service data, mediation continued to be the preeminent ADR technique during the formal complaint process in FY 2003 at 65%. The second most popular ADR technique at the formal complaint stage was the settlement conference, used in nearly 22% of the ADR attempts.
Table 26 - ADR Attempts During the Formal Complaint Process
(Excluding the U.S. Postal Service)
FY 2003
| ADR Attempts | Complaints | Percentage |
|---|---|---|
| Mediation | 770 | 65.03% |
| Settlement Conference | 256 | 21.62% |
| Facilitation | 74 | 6.25% |
| Fact Finding | 56 | 4.73% |
| Multiple Techniques | 14 | 1.18% |
| Minitrial | 6 | 0.18% |
| Early Neutral Evaluation | 5 | 0.15% |
| Ombuds | 2 | 0.06% |
| Other Techniques | 1 | 0.08% |
| Total ADR Attempts | 1,184 | 100.00% |
Because the U.S. Postal Service reported 973 out of the 2,202 ADR attempts during the formal complaint process in FY 2004, the government-wide data is largely impacted by that agency. Even excluding the U.S. Postal Service data, mediation continued to be the preeminent ADR technique during the formal complaint process in FY 2004 at 82%. The second most popular ADR technique at the formal complaint stage was the settlement conference, used in 10% of the ADR attempts.
Table 26a - ADR Attempts During the Formal Complaint Process
(Excluding the U.S. Postal Service)
FY 2004
| ADR Attempts | Complaints | Percentage |
|---|---|---|
| Mediation | 1004 | 81.69% |
| Settlement Conference | 123 | 10.01% |
| Facilitation | 59 | 4.80% |
| Fact Finding | 15 | 1.22% |
| Multiple Techniques | 23 | 1.87% |
| Minitrial | 0 | 0.00% |
| Early Neutral Evaluation | 3 | 0.25% |
| Ombuds | 2 | 0.16% |
| Other Techniques | 0 | 0.00% |
| Total ADR Attempts | 1,229 | 100.00% |
The maximum time allowed for ADR during the formal complaint process is 90 days. A three- year analysis of the data shows that the average processing time (APT) for ADR attempts during the formal complaint process decreased from 65 days in FY 2002 to 58 days in FY 2003 but increased to 92 days in FY 2004.26 As such, the efficiency of the ADR attempts decreased by 27 days in the three year period. The average processing time over the three year period is 72 days.
Table 27 - Average Processing Time By ADR Attempts
During the Formal Complaint Process
FYs 2002 - 2004
| ADR Techniques | Average Processing Time | ||
|---|---|---|---|
| FY 2002 | FY 2003 | FY 2004 | |
| Mediation | 62 days | 58 days | 95 days |
| Settlement Conference | 85 days | 64 days | 103 days |
| Facilitation | 28 days | 58 days | 31 days |
| Fact Finding | 125 days | 54 days | 6 days |
| Multiple Techniques | N/A | 6 days | 25 days |
| Minitrial | N/A | 88 days | 0 days |
| Early Neutral Evaluation | 20 days | 12 days | 63 days |
| Ombuds | N/A | 40 days | 13 days |
| Other Techniques | 45 days | 28 days | 0 days |
| Total ADR Attempts | 65 days | 58 days | 92 days |
The Administrative Dispute Resolution Act defines a neutral as an individual who, with respect to an issue in controversy, functions specifically to aid the parties in resolving the controversy.27 In the federal sector, ADR programs have the discretion to select the source(s) of neutrals to conduct ADR proceedings.
During FY 2004, federal sector ADR programs selected neutrals from the following sources: (1) in-house (employees within the agency); (2) another federal agency; (3) private organizations; (4) multiple sources; and (5) other sources.
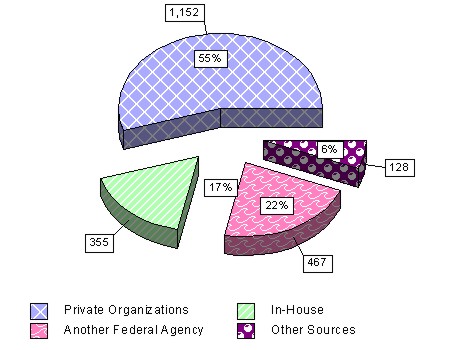
Government-wide data shows that in FY 2004, neutrals from private organizations (including bar associations, individual volunteers, and contractors) were selected more often than any other source of neutrals. A three-year analysis of the data shows that neutrals from private organizations were used at an increasing rate, climbing from 41% in FY 2002 to 67% in FY 2003 but then declining to 55% in FY 2004. Since FY 2000, neutrals from private organizations have averaged 47% of all ADR attempts.
Figure 10 - Sources of Neutrals Used in the Formal Complaint Process FY 2004
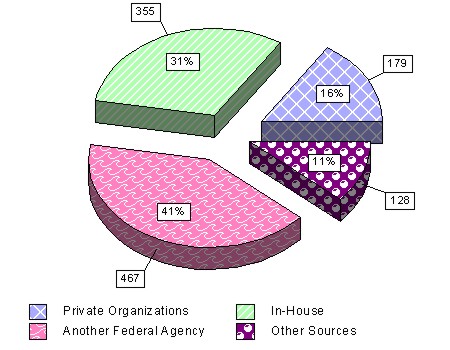
Because the U.S. Postal Service reported 973 out of the 2,202 total complaints in which ADR was utilized in FY 2004, the government-wide data is largely impacted by that agency. When the U.S. Postal Service data is excluded from the number of ADR attempts, federal agencies selected neutrals from another federal agency more frequently than any other source of neutrals in FY 2004.28
A three-year analysis of the data shows that neutrals from another agency were used at an increasing rate, climbing from 40% in FY 2002 to 47% in FY 2003 but decreased to 41% in FY 2004. Since FY 2000, the use of in-house neutrals has averaged 41% of all ADR attempts, while neutrals from another federal agency has averaged 42%.
Figure 11 - Sources of Neutrals Used During the Formal Complaint Process (Excluding the U.S. Postal Service) FY 2004
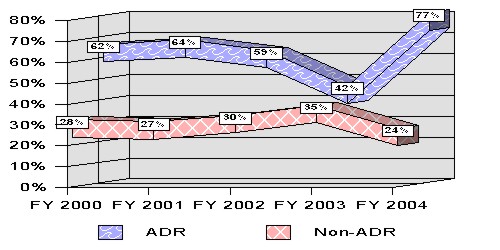
One factor in determining the effectiveness of ADR in the federal sector EEO process is the percentage of EEO disputes that are resolved each year.29 Of the 2,212 ADR closures during the formal complaint process in FY 2004, 1,704 (77%) resulted in a settlement or withdrawal.30 A three-year analysis of the data shows that the ADR resolution rate at the formal complaint stage decreased by 17 percentage points, falling from 59% in FY 2002 to 42% in FY 2003 but increasing by 35 percentage points to 77% in FY 2004. Since FY 2000, the ADR resolution rate has increased by 15 percentage points, increasing from 62% in FY 2000 to 77% in FY 2004. The ADR resolution rate has averaged nearly 61% over the five-year period.
Figure 12 - Trends in ADR Resolutions During the Formal Complaint Process FYs 2000 - 2004
In FY 2003, the Department of Labor had the highest ADR resolution rate in the formal complaint process. The ADR resolution rate is obtained by dividing the number of ADR resolutions by the number of ADR closures. A table with the complete ranking of agencies by ADR resolution rate is located at www.eeoc.gov/federal/adr/datatables/index.html.
Table 28 - Highest ADR Resolution Rate in the Formal Complaint Process
FY 2003
| Agencies | ADR Closures | ADR Resolutions | Resolution Rate |
|---|---|---|---|
| Department of Labor | 32 | 32 | 100% |
| National Archives & Records Administration | 13 | 12 | 92% |
| Department of the Interior | 64 | 58 | 91% |
| Department of the Air Force | 145 | 126 | 87% |
| Department of Transportation | 60 | 52 | 87% |
In FY 2004, the United States Postal Service had the highest ADR resolution rate in the formal complaint process.
Table 28a - Highest ADR Resolution Rate in the Formal Complaint Process
FY 2004
| Agencies | ADR Closures | ADR Resolutions | Resolution Rate |
|---|---|---|---|
| United States Postal Service | 977 | 911 | 93% |
| Department of the Navy | 22 | 20 | 91% |
| Department of Energy | 11 | 10 | 91% |
| Department of Labor | 57 | 50 | 88% |
| Department of Agriculture | 133 | 101 | 76% |
In FY 2003, the National Archives & Records Administration had the most improved ADR resolution rate in the formal complaint process. The most improved ADR resolution rate is determined by subtracting the ADR resolution rate for FY 2002 from the resolution rate for FY 2003.
Table 29 - Most Improved ADR Resolution Rate in the Formal Complaint Process
FYs 2002 - 2003
| Agencies | Resolution Rate | Increase in Resolutions | |
|---|---|---|---|
| FY 2002 | FY 2003 | ||
| National Archives & Records Admin. | 0% | 92% | 92% |
| Department of Justice | 18% | 79% | 61% |
| Department of the Interior | 46% | 91% | 45% |
| Department of Transportation | 45% | 87% | 42% |
| Department of Agriculture | 43% | 70% | 27% |
In FY 2004, the United States Postal Service had the most improved ADR resolution rate in the formal complaint process. The most improved ADR resolution rate is determined by subtracting the ADR resolution rate for FY 2003 from the resolution rate for FY 2004.
Table 29a - Most Improved ADR Resolution Rate in the Formal Complaint Process
FYs 2003 - 2004
| Agencies | Resolution Rate | Increase in Resolutions | |
|---|---|---|---|
| FY 2003 | FY 2004 | ||
| United States Postal Service | 30% | 93% | 63% |
| Defense Army & Air Force Exchange Services | 17% | 73% | 56% |
| Department of Energy | 53% | 91% | 38% |
| Department of Health and Human Services | 38% | 65% | 27% |
| Department of State | 33% | 60% | 27% |
In FY 2003, the Defense Finance & Accounting Service had the largest decline in ADR resolution rate in the formal complaint process. The largest decline in ADR resolution rate is determined by subtracting the ADR resolution rate for FY 2003 from the resolution rate for FY 2002.
Table 30 - Largest Decline in ADR Resolution Rate
in the Formal Complaint Process
FYs 2002 - 2003
| Agencies | Resolution Rate | Decrease in Resolutions | |
|---|---|---|---|
| FY 2002 | FY 2003 | ||
| Defense Finance & Accounting Service | 80% | 53% | -27% |
| U.S. Postal Service | 51% | 30% | -21% |
| Department of the Army | 85% | 65% | -20% |
| Department of Treasury | 76% | 58% | -18% |
| Defense Commissary Agency | 89% | 77% | -12% |
In FY 2004, the Department of the Interior had the largest decline in ADR resolution rate in the formal complaint process. The largest decline in ADR resolution rate is determined by subtracting the ADR resolution rate for FY 2004 from the resolution rate for FY 2003.
Table 30a - Largest Decline in ADR Resolution Rate
in the Formal Complaint Process
FYs 2003 - 2004
| Agencies | Resolution Rate | Decrease in Resolutions | |
|---|---|---|---|
| FY 2003 | FY 2004 | ||
| Department of the Interior | 91% | 37% | -54% |
| Department of Justice | 79% | 35% | -44% |
| Defense Commissary Agency | 77% | 51% | -26% |
| Department of Transportation | 87% | 62% | -25% |
| Defense Contract Management Agency | 62% | 43% | -19% |
In FY 2003, the combined average processing time (APT) for settlements and withdrawals of all complaint closures was 470 days, while the merit decisions and dismissals were 588 days. Hence, resolutions of complaint closures were completed, on average, 118 days faster than final actions.
Table 31 - Average Processing Time of All Complaint Closures
FY 2003
| Type of Complaint Closure | Complaint Closures | Total Days of Complaint Closures | Average Processing Time |
|---|---|---|---|
| Dismissals | 2,723 | 684,597 | 251 Days |
| Withdrawals | 2,296 | 872,885 | 380 Days |
| Settlements | 5,573 | 2,827,300 | 507 Days |
| Merit Decisions | 9,180 | 6,311,842 | 688 Days |
| Total Closures | 19,772 | 10,696,624 | 541 Days |
In FY 2004, the combined average processing time (APT) for settlements and withdrawals of all complaint closures was 417 days, while the merit decisions and dismissals were 490 days. Hence, resolutions of complaint closures were completed, on average, 73 days faster than final actions.
Table 31a - Average Processing Time of All Complaint Closures
FY 2004
| Type of Complaint Closure | Complaint Closures | Total Days of Complaint Closures | Average Processing Time |
|---|---|---|---|
| Dismissals | 5,444 | 816,262 | 150 |
| Withdrawals | 2,325 | 716,228 | 308 |
| Settlements | 4,469 | 2,116,007 | 473 |
| Merit Decisions | 10,915 | 7,200,470 | 660 |
| Total Closures | 23,153 | 10,848,967 | 469 |
A three-year analysis of the data shows that the average processing time (APT) for ADR closures during the formal complaint process decreased substantially from 82 days in FY 2002 to 62 days in FY 2003 but more than doubled to 127 days in FY 2004. As such, the average APT over the last three years has been 90 days.
Table 32 - Average Processing Time in the Formal Complaint ADR Process
FY 2004
| Types of ADR Closure | ADR Closures | Total Days of ADR Closures | Average Processing Time |
|---|---|---|---|
| Settlement | 1,250 | 181,520 | 145 days |
| Withdrawal | 454 | 48,466 | 107 days |
| No Resolution | 492 | 50,225 | 102 days |
| Other | 16 | 1,178 | 74 days |
| Total | 2,212 | 281,389 | 127 days |
In FY 2003, the Department of Transportation had the fastest average processing time for ADR closures in the formal complaint process.
Table 33 - Fastest Average Processing Time in the Formal Complaint Process
FY 2003
| Agencies | ADR Closures | Total Days of ADR Closures | Average Processing Time |
|---|---|---|---|
| Department of Transportation | 60 | 223 | 4 days |
| Department of the Interior | 64 | 418 | 7 days |
| National Aeronautics and Space Administration | 22 | 210 | 10 days |
| Social Security Administration | 13 | 163 | 13 days |
| Department of the Air Force | 145 | 2,452 | 17 days |
In FY 2004, the Defense National Guard Bureau had the fastest average processing time for ADR closures in the formal complaint process.
Table 33a - Fastest Average Processing Time in the Formal Complaint Process
FY 2004
| Agencies | ADR Closures | Total Days of ADR Closures | Average Processing Time |
|---|---|---|---|
| Defense National Guard Bureau | 16 | 248 | 16 |
| Defense Finance and Accounting Service | 16 | 364 | 23 |
| National Aeronautics and Space Administration | 18 | 540 | 30 |
| Department of the Air Force | 190 | 6,319 | 33 |
| Department of Transportation | 52 | 1,857 | 36 |
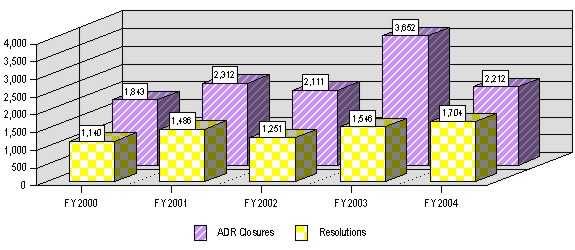
Of the 23,147 complaint closures in FY 2004, there were 6,794 (29%) resolutions, including a total of 4,469 settlements. These resolutions were obtained through ADR and other negotiation processes during the formal complaint stage (i.e., non-ADR process). A three-year analysis of the data shows that the total resolution rate increased by six percentage points, climbing from 34% in FY 2002 to 40% in FY 2003 but decreased to 29% in FY 2004. Since FY 2000, the total resolution rate has decreased by two percentage points, from 31% in FY 2000 to 29% in FY 2004.
Table 34 - Comparison of Formal Complaint Resolutions 31
FYs 2000 - 2004
| Fiscal Year | Total Complaint Closures | Settlements (Complaints) | Withdrawals (Complaints) | Total Resolutions (Complaints) | |||||
|---|---|---|---|---|---|---|---|---|---|
| Total | ADR | Non-ADR | ADR | Non-ADR | ADR | Non-ADR | ADR | Non-ADR | |
| 2000 | 27,177 | 1,843 | 26,037 | 980 | 4,814 | 160 | 2,405 | 1,140 | 7,219 |
| 2001 | 25,283 | 2,312 | 23,797 | 1,336 | 3,925 | 150 | 2,397 | 1,486 | 6,322 |
| 2002 | 22,889 | 2,111 | 21,638 | 1,131 | 4,475 | 120 | 2,085 | 1,251 | 6,560 |
| 2003 | 19,772 | 3,652 | 18,226 | 1,375 | 4,198 | 171 | 2,125 | 1,546 | 6,323 |
| 2004 | 23,147 | 2,212 | 21,443 | 1,250 | 3,219 | 454 | 1,871 | 1,704 | 5,090 |
In FY 2004, the ADR resolution rate of 77% exceeded the non-ADR resolution rate of 24%. From FY 2000 to FY 2004, ADR has averaged a resolution rate of 61%, while non-ADR has averaged a resolution rate of 29%. The chart below identifies the trend in resolution rates for ADR and non-ADR processes during the formal complaint stage of the EEO process from FY 2000 to FY 2004.
Figure 13 - Trends in Resolution Rates During the Formal Complaint Process FYs 2000 - 2004
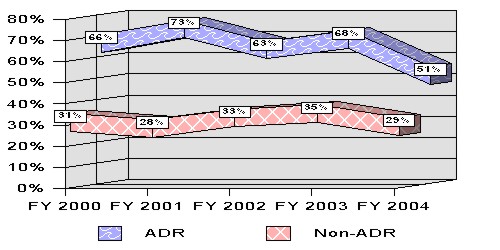
Because the U.S. Postal Service reported 977 out of the 2,212 ADR closures in FY 2004, the government-wide data is largely impacted by that agency. When the U.S. Postal Service is excluded from the government-wide data, the resolution rate in FY 2004 sharply decreased for ADR (from 77% to 51%) and increased slightly for non-ADR (from 24% to 29%). Over the last five years, the average resolution rate declined for ADR (from 68% to 64%) and slightly improved for non-ADR (from 30% to 31%).
Figure 14 - Trends in Resolution Rates During the Formal Complaint Process (Excluding the U.S. Postal Service) FYs 2000 - 2004
The types of monetary benefits reported were: (1) compensatory damages; (2) back pay/front pay; (3) lump sum; (4) attorney's fees; and (5) other monetary benefits. The types of non- monetary benefits reported were: (1) new hire; (2) promotion; (3) reinstatement; (4) expungement of records; (5) transfer; (6) rescind removal/voluntary resignation; (7) reasonable accommodation; and (8) other non-monetary benefits.
During the formal complaint process in FY 2004, 4,739 complaint closures received monetary benefits, totaling $29,695,920, with either ADR or non-ADR settlements. In FY 2004, the average amount of monetary benefits for the complaint closures (i.e., settlements and findings of discrimination) was $6,266 per case. Since FY 2001, the average amount of monetary benefits in the complaint closures was $6,222 per case.
Table 35 - Comparison of Formal Complaint Monetary Benefits
FYs 2001 - 2004
| Fiscal Year | Complaints Receiving Monetary Benefits 32 | Monetary Benefits | Average Monetary Benefits | ||||||
|---|---|---|---|---|---|---|---|---|---|
| Total | ADR | Non-ADR | Total | ADR | Non-ADR | Total | ADR | Non-ADR | |
| 2001 | 5,522 | 694 | 4,828 | $32,941,218 | $6,790,337 | $26,150,881 | $5,965 | $9,784 | $5,417 |
| 2002 | 5,854 | 655 | 5,199 | $33,528,757 | $5,914,384 | $27,614,373 | $5,727 | $9,030 | $5,311 |
| 2003 | 5,823 | 785 | 5,038 | $40,328,926 | $6,027,764 | $34,301,162 | $6,926 | $7,679 | $6,808 |
| 2004 | 4,739 | 485 | 4,254 | $29,695,920 | $3,209,199 | 26,486,721 | $6,266 | $6,617 | $6,226 |
During the formal complaint process in FY 2003, there were 1,375 ADR settlements, including 785 with monetary benefits totaling $6,027,764, and 4,198 settlements out of the 5,038 non-ADR complaint closures that received monetary benefits. In FY 2003, the average amount of monetary benefits was $7,679 for ADR settlements.
The table below shows that in FY 2003, lump sum payments were the most frequently used type of monetary settlement benefit; however, compensatory damages had the highest average of monetary benefits.
Table 36 - ADR Monetary Benefits in the Formal Complaint Process 33
FY 2003
| Types of Monetary Benefits | ADR Settlements (complaints) | ADR Monetary Benefits | Average Monetary Benefits |
|---|---|---|---|
| Lump Sum | 360 | $2,407,430 | $6,687 |
| Attorney's Fees | 150 | $945,564 | $6,304 |
| Compensatory Damages | 152 | $1,920,879 | $12,637 |
| Back Pay/Front Pay | 119 | $712,577 | $5,988 |
| Other Benefits | 21 | $41,314 | $1,967 |
| Total Monetary Benefits | 785 | $6,027,764 | $7,679 |
During the formal complaint process in FY 2004, there were 1,250 ADR settlements, including 485 with monetary benefits totaling $3,209,199, and 996 settlements out of the 2,527 non-ADR complaint closures that received monetary benefits. In FY 2004, the average amount of monetary benefits was $6,617 for ADR settlements. Since FY 2001, the average amount of monetary benefits was $8,278 for ADR settlements.
The table below shows that in FY 2004, lump sum payments were the most frequently used type of monetary settlement benefit with the highest average of monetary benefits.
Table 36a - ADR Monetary Benefits in the Formal Complaint Process 34
FY 2004
| Types of Monetary Benefits | ADR Settlements (complaints) | ADR Monetary Benefits | Average Monetary Benefits |
|---|---|---|---|
| Lump Sum | 237 | $1,851,880 | $7,814 |
| Attorney's Fees | 117 | $589,365 | $5,037 |
| Compensatory Damages | 77 | $470,607 | $6,112 |
| Back Pay/Front Pay | 41 | $270,602 | $6,600 |
| Other Benefits | 33 | $26,745 | $810 |
| Total Monetary Benefits | 485 | $3,209,199 | $6,617 |
During the formal complaint process in FY 2003, ADR efforts resulted in 1,375 settlements, including 936 with non-monetary benefits. The table below shows that in FY 2003, other non- monetary benefits was the most frequently used, appearing in 404 of the ADR settlements. Examples of other non-monetary benefits include a modified appraisal rating, an updated position description, priority consideration, a detail, a desk audit, leave restored/modified, a neutral reference, and a reassignment of duties.
Table 37 - ADR Non-Monetary Benefits in the Formal Complaint Process 35
FY 2003
| Types of Non-Monetary Benefits | ADR Settlements (Complaints) |
|---|---|
| Other Non-Monetary Benefits | 404 |
| Expungement of Records | 193 |
| Transfer | 96 |
| Training | 85 |
| Reasonable Accommodation | 56 |
| Apology | 54 |
| Removal Rescinded/Voluntary Resignation | 54 |
| Promotion | 52 |
| Reinstatement | 32 |
| New Hire | 21 |
| Total Non-Monetary Benefits | 936 |
During the formal complaint process in FY 2004, ADR efforts resulted in 1,250 settlements, including 966 with non-monetary benefits. The table below shows that in FY 2004, other non- monetary benefits was the most frequently used, appearing in 585 of the ADR settlements.
Table 37a - ADR Non-Monetary Benefits in the Formal Complaint Process 36 FY 2004
| Types of Non-Monetary Benefits | ADR Settlements (Complaints) |
|---|---|
| Other Non-Monetary Benefits | 585 |
| Expungement of Records | 110 |
| Transfer | 59 |
| Training | 79 |
| Reasonable Accommodation | 25 |
| Apology | 131 |
| Removal Rescinded/Voluntary Resignation | 37 |
| Promotion | 62 |
| Reinstatement | 17 |
| New Hire | 7 |
| Total Non-Monetary Benefits | 966 |
ADR Attempts - The number of counselings or complaints that started an ADR technique(s) during a specific fiscal year.
ADR Closures - The number of counselings or complaints that complete the ADR process during a fiscal year. This term does not indicate that the agency has closed these counselings or complaints in either the pre-complaint stage or the formal complaint stage.
ADR Election Rate - Of the completed counselings or complaint workload that received an ADR offer, the election rate represents the percentage that participated in the ADR process.
ADR Intake Officers - An individual in the ADR program who has been trained to conduct counseling duties for aggrieved individuals who have not contacted the EEO office.
ADR Offer Rate - The percentage of completed counselings or complaint workload that received an ADR offer.
ADR Offers - The decision by an agency to offer ADR to an individual during the EEO process.
ADR Participation Rate - The percentage of completed counselings or complaint workload where both parties agreed to participate in ADR.
ADR Resolution Rate - The percentage of ADR closures that were resolved by either settlement or withdrawal from the EEO process.
ADR Techniques - The methods used by an ADR program to resolve disputes. Types of ADR techniques include mediation, settlement conference, facilitation, early neutral evaluation, peer review, ombuds, fact finding, and mini-trial.
ADR Usage - The agreement by both parties to participate in the ADR process.
Alternative Dispute Resolution - A term used to describe a variety of approaches to resolve conflict rather than traditional adjudicatory methods. ADR is a process in which a third party neutral assists in resolving disputes by using various techniques to reach a resolution acceptable to the parties.
Average Processing Time - The total number of days divided by the number of ADR attempts or ADR closures.
Complaint Closures - The agency's decision to close a complaint during the formal complaint stage as a result of settlement, withdrawal, dismissal, or merit decision.
Complaint Workload - The combined total of complaints filed, complaints pending from the previous fiscal year, and complaints remanded for investigation.
Complaints - An EEO dispute during the formal complaint stage of the EEO process.
Counselings - An EEO dispute during the pre-complaint stage of the EEO process.
Neutrals - An impartial third party who has no vested interest in the outcome of a dispute.
Parties - The parties in an EEO dispute include the aggrieved individual (or complainant) and the agency that is named in the complaint.
Resolutions - Resolutions include settlements where individuals received monetary and/or non-monetary benefits, and matters where the individual withdrew a counseling or a complaint from the EEO process.
Settlements - A counseling or complaint where the individual received monetary and/or non- monetary benefits from the agency in return for withdrawing the matter from the EEO process.
Withdrawals (No Formal Complaint Filed) - A counseling or complaint where the individual withdrew the matter from the EEO process without receiving any monetary and/or non-monetary benefits from the agency. In the pre-complaint stage, a withdrawal is also referred to as "No Formal Complaint Filed."
Footnotes
1 The goals of the Five Point Plan include proactive prevention, proficient resolution, promote and expand ADR, strategic enforcement and litigation, and EEOC as a model workplace. The Five Point Plan can be viewed in its entirety on the EEOC's webpage http://www.eeoc.gov/abouteeoc/plan under the heading, "Strategic Plan For Fiscal Years 2004 - 2009."
2 ADR is a process in which a third party neutral assists the disputants in reaching an amicable resolution through the use of various techniques. ADR describes a variety of approaches to resolve conflict which avoid the cost, delay, and unpredictability of the traditional adjudicatory processes.
3 See Jeffrey M. Senger, Federal Dispute Resolution: Using ADR with the United States Government, 3 - 10 (Jossey-Bass/John Wiley & Sons, 2003), which is located at www.usdoj.gov/odr/articles.htm.
4 The partner agencies were Court Services and Offender Supervision Agency, Defense Commissary Agency, Defense Information Systems Agency, Department of the Air Force, Department of the Army, Department of Education, Department of Justice, Department of Labor, Department of State, Department of Veteran Affairs, Export-Import Bank, Federal Communications Commission, Federal Trade Commission, Government Printing Office, National Gallery of Art, National Guard Bureau, Nuclear Regulatory Commission, Security and Exchange Commission, Small Business Administration, Social Security Administration, and United States Postal Service.
5 The Peace Corps reported that it did not establish or make available an ADR program in FY 2003; however, that agency developed an ADR program, which it implemented in FY 2004.
6 These agencies included: Central Intelligence Agency; Defense Intelligence Agency; and National Imagery and Mapping Agency, now known as Defense National Geospatial-Intelligence Agency.
7 The EEOC did not collect data on ADR offers until FY 2002. The total counseled for FY 2000 has been corrected by excluding the instances of counseling initiated with ADR Intake Officers due to concerns about the accuracy of the data.
8 In this ADR Report, all ranking tables will exclude agencies with fewer than 10 of the applicable ADR offers, cases processed in ADR, or ADR closures.
9 The ADR offer rate was adjusted to 100% for those agencies that submitted data which resulted in an ADR offer rate of over 100%. The number of ADR offers may exceed the instances of counseling because the instances of counseling contains only matters that were completed during the fiscal year while ADR offers include instances of counseling that were pending and/or completed at the end of the fiscal year.
10 An ADR attempt includes all instances of counseling that initiated an ADR proceeding during the current fiscal year.
11 In this table, for each ADR attempt during the pre-complaint process in FY 2003 and FY 2004, the average processing time tracks the number of days between the date that the individual elected ADR (accepted the agency's ADR offer during the reporting period) and the date that the ADR process or the reporting period ended. For the purpose of calculating the average days, ADR attempts were not considered if the agencies did not report the number of days.
12 For more information about the use of neutrals in the federal sector EEO process, refer to the Administrative Dispute Resolution Act, 5 U.S.C. Section 571(9), and Chapter 3 of MD-110.
13 In addition to resolving EEO disputes, ADR may also improve the parties' communication skills, reduce tension in the workplace, and help both parties avoid costly litigation expenses. Presently, there is insufficient data to evaluate ADR's impact on these other factors.
14 The term "resolutions" includes settlements where individuals received monetary and/or non-monetary benefits, and matters where no formal complaint was filed. The term "no resolutions" includes matters where ADR failed to resolve the dispute and the agency continued processing the complaint.
15 In March 2003, FEMA became part of the Department of Homeland Security's Emergency Preparedness and Response Directorate.
16 To determine the duration of each ADR case, agencies are instructed to add the number of days from the date the counselee elected ADR during the reporting period (accepted the agency's ADR offer) or the first day of the reporting period (for ADR attempts pending at the beginning of the reporting period), to the date that the ADR process ended.
17 The number of settlements (8,298) in the pre-complaint process differs from the number (8,199) reported in the FY 2003 Annual Report on the Federal Workforce due to a correction of the reported EEO counseling settlements from 1,031 to 1,130.
18 The total number of instances of counseling that settled does not equal the aggregate of each type of benefit, since one settlement agreement could include more than one type of monetary and/or non-monetary benefit.
19 Table 16 excludes FY 2000 data due to concerns about the accuracy of the reported instances of counseling that received monetary settlements through ADR.
20 Fiscal years 2001, 2002, and 2003.
21 The total number of instances of counseling that settled with monetary benefits does not equal the aggregate of each type of monetary benefit, since one settlement agreement could include more than one type of monetary benefit.
22 The total number of instances of counseling that settled with monetary benefits does not equal the aggregate of each type of monetary benefit, since one settlement agreement could include more than one type of monetary benefit.
23 The total number of instances of counseling that settled with non-monetary benefits does not equal the aggregate of each type of non-monetary benefit, since one settlement agreement could include more than one type of non-monetary benefit.
24 The total number of instances of counseling that settled with non-monetary benefits does not equal the aggregate of each type of non-monetary benefit, since one settlement agreement could include more than one type of non-monetary benefit.
25 During the formal complaint stage, the EEOC did not collect data on the number of ADR offers until FY 2002 and data on ADR participation rates until FY 2001.
26 For each ADR attempt during the formal complaint process in FY 2003, the average processing time tracks the number of days between the date that the individual elected ADR and the date that the ADR attempt was completed. For the purpose of calculating the average days, ADR attempts were not considered if the agencies did not report the number of days.
27 For more information about the use of neutrals in the federal sector EEO process, refer to the Administrative Dispute Resolution Act, 5 U.S.C. Section 571(9), and Chapter 3 of MD-110.
28 Neutrals from another agency may include agencies that conduct ADR services for a fee, such as the Federal Mediation and Conciliation Service and the Equal Employment Opportunity Commission, as well as agencies that provide free ADR service through a Shared Neutrals Program.
29 In addition to resolving EEO disputes, ADR may also improve parties' communication skills, reduce tension in the workplace, and help both parties avoid costly litigation expenses. Presently, there is insufficient data to evaluate ADR's impact on these factors.
30 The term "resolutions" includes settlements where individuals received monetary and/or non-monetary benefits, and complaints withdrawn from the EEO process. The term "no resolutions" includes matters where ADR failed to resolve the dispute and the agency continued processing the complaint.
31 ADR closures cannot be added to non-ADR closures to obtain the total complaint closures because ADR closures include cases which failed to settle and are pending investigation.
32 Table 35 excludes FY 2000 data due to concerns about the accuracy of the reported complaints that received monetary settlements through ADR. Of the complaints that received monetary benefits, the non-ADR complaints include both settlements through means other than ADR and findings of discrimination because the data does not report the monetary benefits obtained in non-ADR settlements.
33 The total number of complaints that settled with monetary benefits does not equal the aggregate of each type of monetary benefit, since one settlement agreement could include more than one type of monetary benefit.
34 The total number of complaints that settled with monetary benefits does not equal the aggregate of each type of monetary benefit, since one settlement agreement could include more than one type of monetary benefit.
35 The total number of complaints that settled with non-monetary benefits does not equal the aggregate of each type of non-monetary benefit, since one settlement agreement could include more than one type of non-monetary benefit.
36 The total number of complaints that settled with non-monetary benefits does not equal the aggregate of each type of non-monetary benefit, since one settlement agreement could include more than one type of non-monetary benefit.
This page was last modified on October 18, 2005.
