Total Energy
Monthly Energy Review
October 2014 PDF | previous editions
Release Date: October 28, 2014
Next Update: November 25, 2014
This issue marks 40 years of continuous publication of the Monthly Energy Review, beginning with the October 1974 issue. See Note to Readers in the October 2014 issue.
A publication of recent energy statistics. This publication includes total energy production, consumption, and trade; energy prices; overviews of petroleum, natural gas, coal, electricity, nuclear energy, renewable energy, and international petroleum; carbon dioxide emissions; and data unit conversion values.
EIA has expanded Sections 1 through 10 and Appendix A of the Monthly Energy Review (MER) to incorporate annual data as far back as 1949 in those data tables that are published in both the Annual Energy Review 2011 and MER. Similar revisions are pending for Section 12.
Where available, Excel and CSV files now include pre-1973 data. For tables containing monthly and annual data, the Excel files now have two worksheets, one for monthly data and one for annual data.
The Monthly Energy Review now includes interactive data tables and graphs. The interactive tables are currently on EIA's Beta site.
For a record of the expansion, please see "What's New in the Monthly Energy Review - Content Changes."
Data categories
+ EXPAND ALL| Energy overview | |||
|---|---|---|---|
| Topic | PDF (entire section) | ||
| 1.1 Primary energy overview | PDF XLS CSV GRAPH | INTERACTIVE | |
| 1.2 Primary energy production by source | PDF XLS CSV GRAPH | INTERACTIVE | |
| 1.3 Primary energy consumption by source | PDF XLS CSV GRAPH | INTERACTIVE | |
| 1.4a Primary energy imports by source | PDF XLS CSV GRAPH | INTERACTIVE | |
| 1.4b Primary energy exports by source and total net imports |
PDF XLS CSV GRAPH | INTERACTIVE | |
| 1.5 Merchandise trade value | PDF XLS CSV GRAPH | INTERACTIVE | |
| 1.6 Cost of fuels to end users in real (1982-1984) dollars | PDF XLS CSV GRAPH | INTERACTIVE | |
| 1.7 Primary energy consumption per real dollar of gross domestic product |
PDF XLS CSV GRAPH | INTERACTIVE | |
| 1.8 Motor vehicle mileage, fuel consumption, and fuel economy | PDF XLS CSV GRAPH | INTERACTIVE | |
| 1.9 Heating degree-days by Census division | |||
| 1.10 Cooling degree-days by Census division | |||
| Section notes | |||
| Energy consumption by sector | |||
| Topic | PDF (entire section) | ||
| 2.1 Energy consumption by sector | PDF XLS CSV GRAPH | INTERACTIVE | |
| 2.2 Residential sector energy consumption | PDF XLS CSV GRAPH | INTERACTIVE | |
| 2.3 Commercial sector energy consumption | PDF XLS CSV GRAPH | INTERACTIVE | |
| 2.4 Industrial sector energy consumption | PDF XLS CSV GRAPH | INTERACTIVE | |
| 2.5 Transportation sector energy consumption | PDF XLS CSV GRAPH | INTERACTIVE | |
| 2.6 Electric power sector energy consumption | PDF XLS CSV GRAPH | INTERACTIVE | |
| Section notes | |||
| Petroleum | |||
| Topic | PDF (entire section) | ||
| 3.1 Overview | PDF XLS CSV GRAPH | INTERACTIVE | |
| 3.2 Refinery and blender net inputs and net production | PDF XLS CSV GRAPH | INTERACTIVE | |
| 3.3 Trade: | |||
| 3.3a Overview | PDF XLS CSV GRAPH | INTERACTIVE | |
| 3.3b Imports and exports by type | PDF XLS CSV GRAPH | INTERACTIVE | |
| 3.3c Imports from OPEC countries | PDF XLS CSV GRAPH | INTERACTIVE | |
| 3.3d Imports from non-OPEC countries | PDF XLS CSV GRAPH | INTERACTIVE | |
| 3.4 Stocks | PDF XLS CSV GRAPH | INTERACTIVE | |
| 3.5 Products supplied by type | PDF XLS CSV GRAPH | INTERACTIVE | |
| 3.6 Heat content of petroleum products supplied by type | PDF XLS CSV GRAPH | INTERACTIVE | |
| 3.7 Petroleum consumption by sector: | |||
| 3.7a Residential and commercial sectors | PDF XLS CSV GRAPH | INTERACTIVE | |
| 3.7b Industrial sector | PDF XLS CSV GRAPH | INTERACTIVE | |
| 3.7c Transportation and electric power sectors | PDF XLS CSV GRAPH | INTERACTIVE | |
| 3.8 Heat content of petroleum consumption by sector: | |||
| 3.8a Residential and commercial sectors | PDF XLS CSV GRAPH | INTERACTIVE | |
| 3.8b Industrial sector | PDF XLS CSV GRAPH | INTERACTIVE | |
| 3.8c Transportation and electric power sectors | PDF XLS CSV GRAPH | INTERACTIVE | |
| Section notes | |||
| Natural gas | |||
| Topic | PDF (entire section) | ||
| 4.1 Overview | PDF XLS CSV GRAPH | INTERACTIVE | |
| 4.2 Trade by country | PDF XLS CSV | INTERACTIVE | |
| 4.3 Consumption by sector | PDF XLS CSV GRAPH | INTERACTIVE | |
| 4.4 Underground storage | PDF XLS CSV | INTERACTIVE | |
| Section notes | |||
| Crude oil and natural gas resource development | |||
| Topic | PDF (entire section) | ||
| 5.1 Drilling activity measurements | PDF XLS CSV GRAPH | INTERACTIVE | |
| 5.2 Exploratory and development wells | PDF XLS CSV GRAPH | INTERACTIVE | |
| Section notes | |||
| Coal | |||
| Topic | PDF (entire section) | ||
| 6.1 Overview | PDF XLS CSV GRAPH | INTERACTIVE | |
| 6.2 Consumption by sector | PDF XLS CSV GRAPH | INTERACTIVE | |
| 6.3 Stocks by sector | PDF XLS CSV | INTERACTIVE | |
| Section notes | |||
| Electricity | |||
| Topic | PDF (entire section) | ||
| 7.1 Overview | PDF XLS CSV GRAPH | INTERACTIVE | |
| 7.2 Electricity net generation: | |||
| 7.2a Total (all sectors) | PDF XLS CSV GRAPH | INTERACTIVE | |
| 7.2b Electric power sector | PDF XLS CSV GRAPH | INTERACTIVE | |
| 7.2c Commercial and industrial sectors | PDF XLS CSV GRAPH | INTERACTIVE | |
|
7.3 Consumption of combustible fuels for electricity generation: |
|||
| 7.3a Total (all sectors) | PDF XLS CSV GRAPH | INTERACTIVE | |
| 7.3b Electric power sector | PDF XLS CSV GRAPH | INTERACTIVE | |
| 7.3c Commercial and industrial sectors (selected fuels) | PDF XLS CSV GRAPH | INTERACTIVE | |
| 7.4 Consumption of combustible fuels for electricity generation and useful thermal output: |
|||
| 7.4a Total (all sectors) | PDF XLS CSV GRAPH | INTERACTIVE | |
| 7.4b Electric power sector | PDF XLS CSV GRAPH | INTERACTIVE | |
| 7.4c Commercial and industrial sectors (selected fuels) | PDF XLS CSV GRAPH | INTERACTIVE | |
| 7.5 Stocks of coal and petroleum: electric power sector | PDF XLS CSV GRAPH | INTERACTIVE | |
| 7.6 Electricity end use | PDF XLS CSV GRAPH | INTERACTIVE | |
| Section notes | Other notes: | Notes on estimated monthly data (1989-2000) | Estimating power sector fuel use | Allocating municipal solid waste to
biogenic and nonbiogenic energy |
| Nuclear energy | |||
| Topic | PDF (entire section) | ||
| 8.1 Overview | PDF XLS CSV GRAPH | INTERACTIVE | |
| Section notes | |||
| Energy prices | |||
| Topic | PDF (entire section) | ||
| 9.1 Crude oil price summary | PDF XLS CSV GRAPH | INTERACTIVE | |
| 9.2 F.O.B. costs of crude oil imports from selected countries | PDF XLS CSV | INTERACTIVE | |
| 9.3 Landed costs of crude oil imports from selected countries | PDF XLS CSV | INTERACTIVE | |
| 9.4 Retail motor gasoline and on-highway diesel fuel prices | PDF XLS CSV | INTERACTIVE | |
| 9.5 Refiner prices of residual fuel oil | PDF XLS CSV GRAPH | INTERACTIVE | |
| 9.6 Refiner prices of petroleum products for resale | PDF XLS CSV | INTERACTIVE | |
| 9.7 Refiner prices of petroleum products to end users | PDF XLS CSV GRAPH | INTERACTIVE | |
| 9.8 Average retail prices of electricity | PDF XLS CSV GRAPH | INTERACTIVE | |
| 9.9 Cost of fossil-fuel receipts at electric generating plants | PDF XLS CSV GRAPH | INTERACTIVE | |
| 9.10 Natural gas prices | PDF XLS CSV GRAPH | INTERACTIVE | |
| Section notes | |||
| Renewable energy | |||
| Topic | PDF (entire section) | ||
| 10.1 Production and consumption by source | PDF XLS CSV GRAPH | INTERACTIVE | |
| 10.2a Consumption: residential and commercial sectors | PDF XLS CSV GRAPH | INTERACTIVE | |
| 10.2b Consumption: industrial and transportation sectors | PDF XLS CSV GRAPH | INTERACTIVE | |
| 10.2c Consumption: electric power sector | PDF XLS CSV GRAPH | INTERACTIVE | |
| 10.3 Fuel ethanol overview | PDF XLS CSV | INTERACTIVE | |
| 10.4 Biodiesel overview | PDF XLS CSV | INTERACTIVE | |
| Notes: | |||
| Section notes | |||
| Allocating municipal solid waste to biogenic and non-biogenic energy | |||
| International petroleum | |||
| Topic | PDF (entire section) | ||
| 11.1 World crude oil production: | |||
| 11.1a OPEC members | PDF XLS CSV GRAPH | INTERACTIVE | |
| 11.1b Persian Gulf nations, non-OPEC, and world | PDF XLS CSV GRAPH | INTERACTIVE | |
| 11.2 Petroleum consumption in OECD countries | PDF XLS CSV GRAPH | INTERACTIVE | |
| 11.3 Petroleum stocks in OECD countries | PDF XLS CSV GRAPH | INTERACTIVE | |
| Section notes | |||
| Environment | |||
| Topic | PDF (entire section) | ||
| Carbon dioxide emissions from energy consumption: | |||
| 12.1 By source | PDF XLS CSV GRAPH | INTERACTIVE | |
| 12.2 Residential sector | PDF XLS CSV GRAPH | INTERACTIVE | |
| 12.3 Commercial sector | PDF XLS CSV GRAPH | INTERACTIVE | |
| 12.4 Industrial sector | PDF XLS CSV GRAPH | INTERACTIVE | |
| 12.5 Transportation sector | PDF XLS CSV GRAPH | INTERACTIVE | |
| 12.6 Electric Power sector | PDF XLS CSV GRAPH | INTERACTIVE | |
| 12.7 Biomass | PDF XLS CSV | INTERACTIVE | |
| Section notes | |||
| Appendices (heat rates, conversion factors, and more) | |||
| Topic | PDF (entire section) | ||
| Approximate heat content of: | |||
| A1 Petroleum products | |||
| A2 Petroleum production, imports, and exports | PDF XLS CSV | INTERACTIVE | |
| A3 Petroleum consumption and biofuels production | PDF XLS CSV | INTERACTIVE | |
| A4 Natural gas | PDF XLS CSV | INTERACTIVE | |
| A5 Coal and coal coke | PDF XLS CSV | INTERACTIVE | |
| A6 Approximate heat rates for electricity, and heat content of electricity |
PDF XLS CSV | INTERACTIVE | |
| Documentation | |||
| B1 Metric conversion factors | |||
| B2 Metric prefixes | |||
| B3 Other physical conversion factors | |||
| Glossary | |||
| Glossary |
Changes this month
- This issue marks 40 years of continuous publication of the Monthly Energy Review, beginning with the October 1974 issue. See Note to Readers in the October 2014 issue.
- Data updates
- See full list of changes
Diagrams
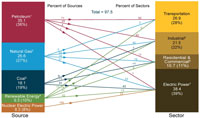
Energy flows
Primary energy consumption