

Top Wind Power Countries Per Capita (CleanTechnica Exclusive)


June 20th, 2013 by Zachary Shahan
The Global Wind Energy Council (GWEC) recently published its final update of 2012 global wind power installation numbers. As such, I am now able to update my “Top Wind Power Countries” lists. If you’ve been a CleanTechnica reader for awhile, you know that I’m all about looking at relative rankings (or creating them when they don’t yet exist). That simply tells us much more about who the true clean energy leaders are than looking at total installation numbers.
In the past, I have created rankings of the top wind power countries per capita, per GDP, and per TWh of electricity production to supplement GWEC’s rankings of the absolute leaders. You can see the 2010 and 2011 rankings here:
- Top Wind Power Countries Per Capita 2011
- Top Wind Power Countries Per GDP 2011
- Top Wind Power Countries Relative To Electricity Production 2011
- Top Wind Power Countries Per Capita & Per GDP 2010
This year, I’ve only created rankings according to population and GDP (like in 2010) because the country-level electricity production data comes from too many sources — it’s not standardized nor very reliable. If there’s great demand for that ranking, maybe I’ll reconsider.
If you’re interested, on Page 2 of this article, you can also find the absolute wind power leaders, global and regional wind power growth, and wind power growth forecasts through 2017 (in the form of charts from GWEC). But below and in my next post are what I think are the really interesting rankings — per capita rankings (for new wind power capacity and for total wind power capacity) and per GDP rankings (again, for new wind power capacity and for total wind power capacity).
Top Wind Power Countries Per Capita 2012
These per capita wind power rankings use population data from Internet World Stats (IWS) and wind power capacity data from GWEC [PDF]. Thanks to IWS and GWEC for gathering those data together!
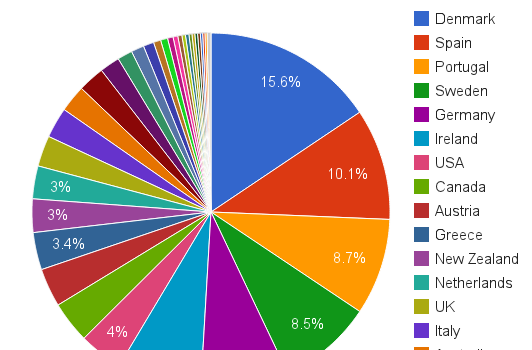
Total Installed Wind Power Capacity Per Capita
I think the total (aka cumulative) wind power capacity numbers are more important than the new (installed in 2012) numbers, since some wind power leaders may have had a slow year or may simply be taking wind power growth more slowly after reaching a certain “high” level of saturation. So, I’m starting with the total wind power installation comparisons. Here are two charts for total installed wind power per capita:

Click & then magnify to enlarge. Image Credit: Zachary Shahan / CleanTechnica

This pie chart represents percentages of total world wind power capacity per capita in countries with notable amounts of wind power. Click & then magnify to enlarge. Image Credit: Zachary Shahan / CleanTechnica
And here’s the table:

Credit: Zachary Shahan / CleanTechnica
Clearly, Denmark is still in a league of its own for wind power. Spain, Portugal, Sweden, Germany, and Ireland are other world leaders that have been going strong in the realm of wind power for awhile now (note that they are all in Europe). The US, Canada, Austria, and Greece round out the top 10. Each of these countries has had strong wind power policies for years.
Meanwhile, China — which many identify as a world leader in wind power due to its high total installation figure — is #19 per capita, and the leading economies of Japan and Brazil are #24 and #28, respectively.
Newly Installed Wind Power Capacity Per Capita
But who are the movers and shakers in new wind power installations per capita? Before scrolling down, do you think you can guess? I’m sure I wouldn’t have guessed #1 or #5, and I’m not sure if I would have gotten the others in the top 10 in the right order… if I even got them all in the top 10. Unfortunately, I didn’t try testing myself before seeing the results.
Have your guesses ready? Here are the charts and table:

Click & then magnify to enlarge. Image Credit: Zachary Shahan / CleanTechnica

This pie chart represents percentages of new world wind power capacity per capita in countries with notable amounts of wind power. Click & then magnify to enlarge. Image Credit: Zachary Shahan / CleanTechnica

Credit: Zachary Shahan / CleanTechnica
Wow, Sweden and Romania are the big leaders this year, especially Sweden. Sweden, with its relatively small population of about 9 million and its quest to become an oil-free nation, clearly had a strong year with 846 megawatts of new wind power. It seems the country’s wind power focus may stay strong for awhile. As we’ve noted recently, it actually has a 72 MW wind farm under construction that will sell all of its electricity to Google. Sweden’s 846 MW of new wind power accounted for 22.5% of the country’s total installed wind power capacity at the end of 2012 (3745 MW).
Romania has also become a hot market for wind power. Vestas actually set up its Eastern European hub there in 2011. And its relatively small population of just under 22 million combined with its rich wind resources also didn’t hurt with this ranking. Romania’s 923 MW of new wind power accounted for 48.5% of its total installed wind power at the end of 2012 (1905 MW).
The US, with it’s massive 13,124 megawatts of new wind power (the #2 source of new power capacity in the country in 2012) rounds out the top 3. A lot of that US capacity was rushed through before the end of the year because of the threat to the country’s wind power production tax credit (PTC), so don’t expect to see such high numbers this year. (The PTC was extended for just one year again, but the projects only have to be started this year — they can be completed in future years.)
Denmark, which has been a consistent wind power leader for years, is #4. It has actually hit over 30% electricity consumption from wind power, and it aims to get 50% of its electricity from wind power by 2020. There’s no denying that Denmark’s love affair with wind power is still going strong and that the country’s perennial wind power love makes it the world’s #1 wind power leader.
Austria also had quite a strong year and has been a pretty consistent wind power leader (without much recognition due to its small size). Its 296 MW of new wind power capacity made up about 21.5% of the country’s total wind power capacity at the end of 2012 (1378 MW).
–> Flip on over to Page 2 to see the absolute wind power leaders, global wind power growth, regional wind power growth, and projected wind power growth through 2017 (numerous pretty charts from GWEC).
–> Click on through to the next post for rankings relative to GDP (to be published about 40 minutes after this post).
Keep up to date with all the hottest cleantech news by subscribing to our (free) cleantech newsletter, or keep an eye on sector-specific news by getting our (also free) solar energy newsletter, electric vehicle newsletter, or wind energy newsletter.
Google+
About the Author
Zachary Shahan spends most of his time here on CleanTechnica as the director/chief editor. Otherwise, he's probably enthusiastically fulfilling his duties as the director/editor of Solar Love, EV Obsession, Planetsave, or Bikocity. Zach is recognized globally as a solar energy, electric car, and wind energy expert. If you would like him to speak at a related conference or event, connect with him via social media. You can connect with Zach on any popular social networking site you like. Links to all of his main social media profiles are on ZacharyShahan.com.
Related Posts
New Kangaroo Island Luxury Eco-Villas Are 100% Solar Powered →
Australia’s Largest EV Fast-Charger Network Is Coming To Queensland →
Renewables, Not Coal, Way Out Of Energy Poverty In Africa →

Seoul, Korea Offering $18,000+ In Incentives To EV Buyers →
-
kasy
-
Bob_Wallace
-
-
http://drjagadeeshncda.blogspot.com/ Anumakonda Jagadeesh
-
Rockne O’Bannon
-
Bob_Wallace
-
Rockne O’Bannon
-
Bob_Wallace
-
Rockne O’Bannon
-
-
-
-
Rick Kargaard
-
Bob_Wallace
-
Rockne O’Bannon
-
-
-
chlobirdcity
-
Benoit
-
JamesWimberley
-
http://zacharyshahan.com/ Zachary Shahan
-
JamesWimberley
-
Bob_Wallace
-
-
-
-
Chris McLeod
-
http://zacharyshahan.com/ Zachary Shahan
-
http://zacharyshahan.com/ Zachary Shahan
-
Chris McLeod
-
http://zacharyshahan.com/ Zachary Shahan
-
-
-
-
Ross
-
Bob_Wallace
-
-
http://www.duurzamebrabanders.nl/blog Henk Daalder Windparken Wiki
-
Paul Caden
-


