CleanTechnica is the #1 cleantech-focused
website
 in the world. Subscribe today!


Clean Power how much solar costs

Published on February 17th, 2012 | by Zachary Shahan

20

How Much Solar Costs & How Much You Could Save On Electricity In Your State (Infographic)

Share on Google+Share on RedditShare on StumbleUponTweet about this on TwitterShare on LinkedInShare on FacebookPin on PinterestDigg thisShare on TumblrBuffer this pageEmail this to someone

February 17th, 2012 by Zachary Shahan 

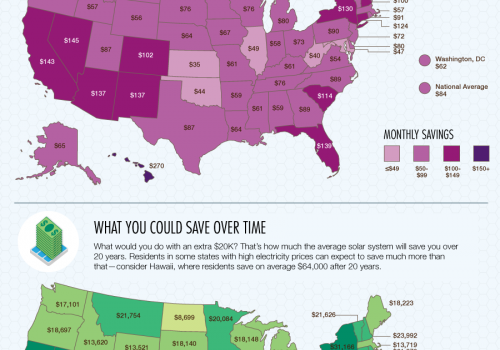
How much could you save by going solar? How much would it cost to install a solar system? What’s your estimated return on investment (ROI)? This infographic below — made by One Block Off the Grid (1BOG)* — regarding how much solar costs has all the answers, and a few more. Well, they are generalized answers, based on the state you live in, but that’s as good as it gets beyond contacting a solar company and getting a quote.

Regarding this infographic, Dave Llorens, 1BOG’s CEO, wrote to me: “I think this is the infographic I’m most proud of so far.” (They make quite a few.) I think I’d agree with him. And, in general, it’s one of my favorite infographics on any topic. :D Check her out (click on the image for a larger version):

How-Much-Does-Solar-Power-Cost

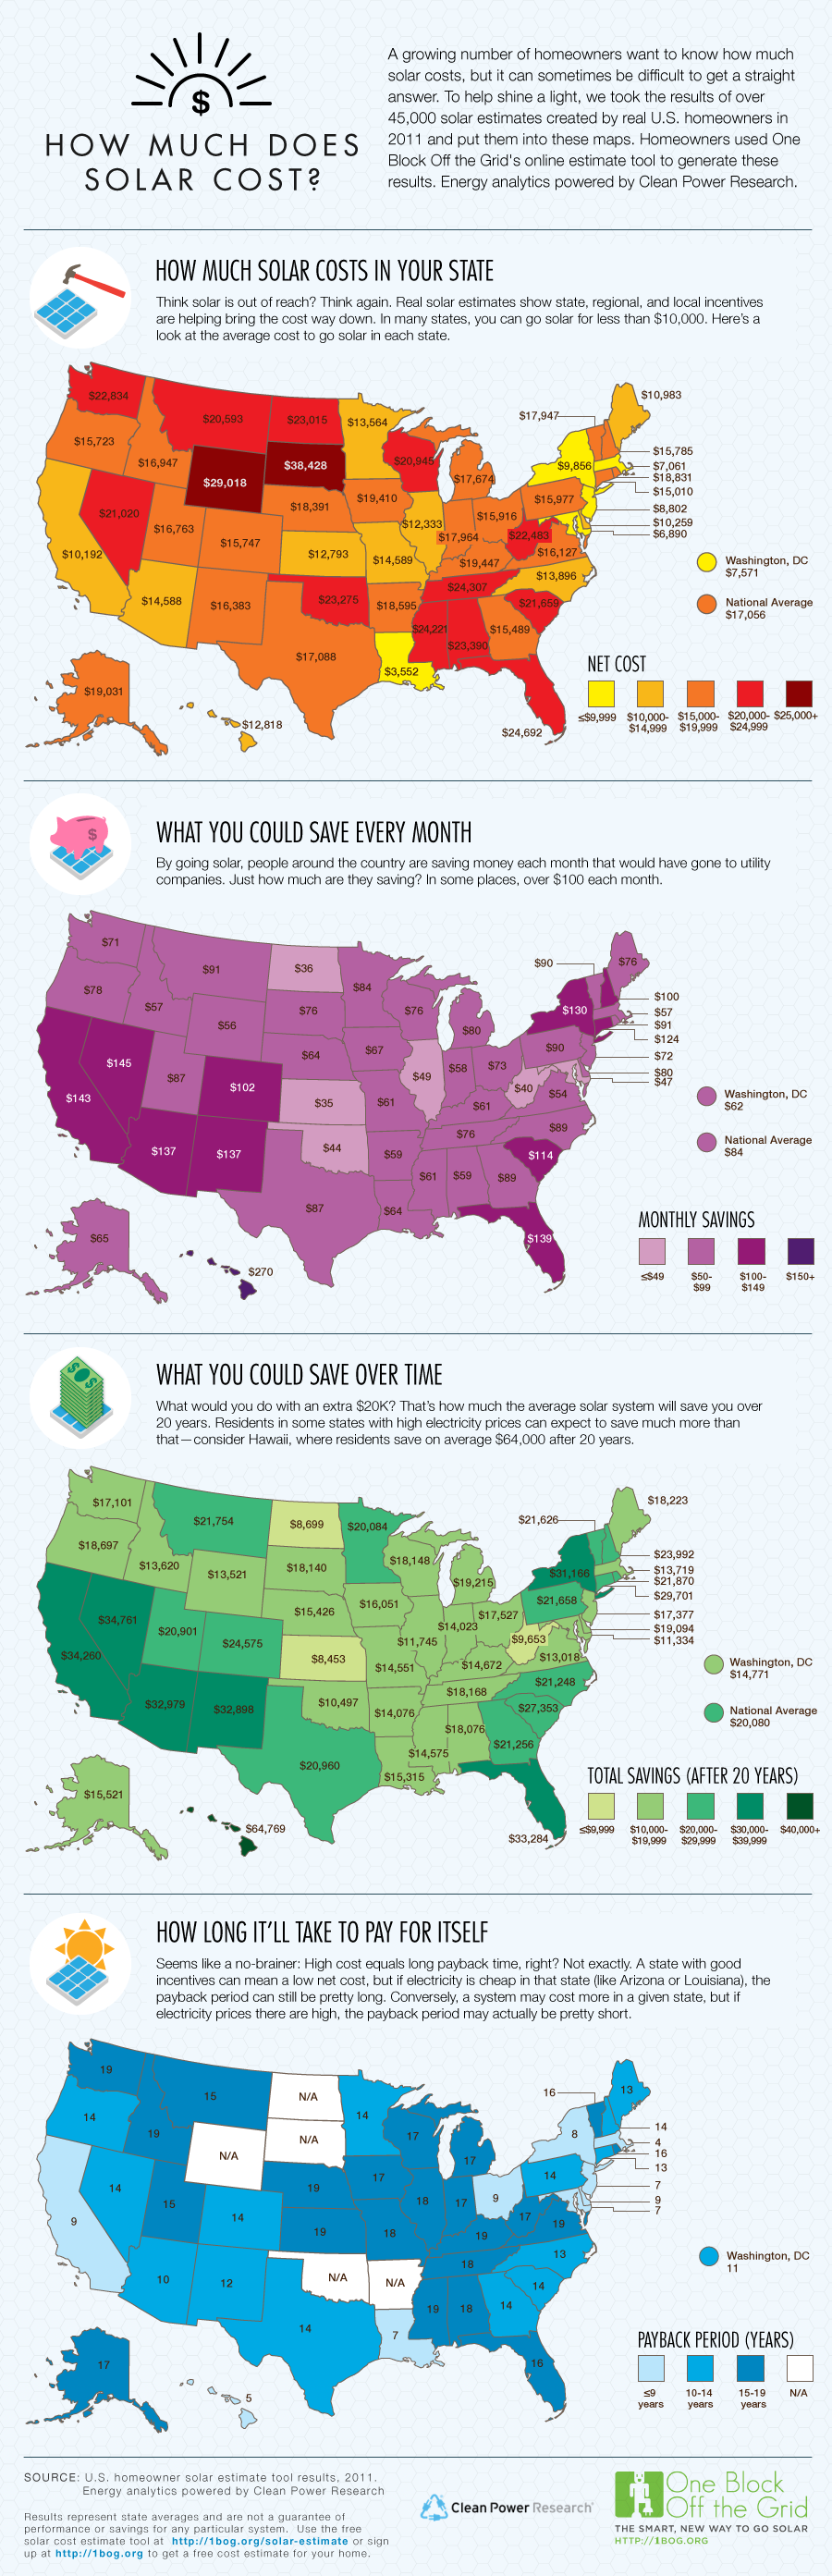
So, perhaps the question isn’t how much solar costs, but how much solar saves you!

*Full disclosure: 1BOG and CleanTechnica have a financial partnership. CleanTechnica does get a cut of the revenue earned from leads through the solar ads on this site. So, if you want to support CleanTechnica while going solar, you know how to do so! (It doesn’t effect the price of your solar system in any way.)

Keep up to date with all the hottest cleantech news by subscribing to our (free) cleantech newsletter, or keep an eye on sector-specific news by getting our (also free) solar energy newsletter, electric vehicle newsletter, or wind energy newsletter.


Share on Google+Share on RedditShare on StumbleUponTweet about this on TwitterShare on LinkedInShare on FacebookPin on PinterestDigg thisShare on TumblrBuffer this pageEmail this to someone

Tags: , , , , , ,


About the Author

spends most of his time here on CleanTechnica as the director/chief editor. Otherwise, he's probably enthusiastically fulfilling his duties as the director/editor of Solar Love, EV Obsession, Planetsave, or Bikocity. Zach is recognized globally as a solar energy, electric car, and wind energy expert. If you would like him to speak at a related conference or event, connect with him via social media. You can connect with Zach on any popular social networking site you like. Links to all of his main social media profiles are on ZacharyShahan.com.


  • focusonzenergy

    The numbers and charts are meaningless without knowing the size of the system.

    The state, regional, and local incentives come out of the utility rate payers pocket. Solar panel incentives is why your electricity bill has doubled, the higher rates go to provide the money for the incentives.

    Thou shalt not steal from thy neighbor!

    • Bob_Wallace

      “Solar panel incentives is why your electricity bill has doubled”

      Read the site rules.

      http://cleantechnica.com/cleantechnica-comment-policy/

      We don’t enjoy having people post FUD.

      • focusonzenergy

        FUD – Fear, uncertainty and doubt.
        Al Gore – He played on our fears!!!!!

        • Bob_Wallace

          Why don’t you try to cool your jets and engage in useful discussion? If you’re going to be all whacked out crazy on us you’ll be a short time visitor.

  • bmack500

    I live in Ky. I have a 3 bedroom house, about 2000 sq ft. My estimate was about $61,000 for a grid – tied system. About $47,000 after subsidies. Where are you folks getting this information?

  • Nrgwise

    The infograpic on solar doesn’t make much sense. It doesn’t show how big the system is. The savings over 20 years is not remotely correct. There are vast differences in Incentives and the amount of sunshine in states. Looking at the savings per month and using PV Watts, you can figure out the system size for different areas of a state. Figuring $4/w for system cost (residential), you can then figure out the federal credit, then you have to find out any utility incentives, any state tax credits. After this I got a 6.5 kw system in Eastern Oregon and a 8.5 kw system in Western Oregon. Obviously with differing prices and paybacks. The larger system after all incentives but with 0% interest would have a 14 year payback as the graphic shows, but a 9.4 year payback with the Eastern Oregon system. Savings with no increases over 20 years would be $5,400 to $9,983. Perhaps there is a crystal ball escalator for energy costs to bring these numbers to $18,697 savings. Lets put in a rate increase of 4% and some depreciation of solar panel output into the equation, we would then get 20 year savings of between $11,375 to $15,925.
    Bottom line, if you show numbers, you have to explain how you get them or they don’t mean anything. Solar modules prices change, competition heats up, utility incentives come and go, there are to many moving numbers to distill it to simple graphics with no explanations.

  • Lee Saberson

    This is a great graphic. BUT, I did not see in the article itself, how big the system is. Mr Wallace says 3KW. Is that correct ?
    Then there is the question of how much the prices have come down.

  • Lily

    Ok, so I’m kinda confused- for the part where it says how much it costs- is that, like for the cost of instillation or for the cities solar energy… or something else???

  • fw

    I have know idea what that map means as there is no reference to avg khw installed

  • OnceTwice

    Those are not the “costs”, but quoted prices. The actual costs are MUCH lower. If you let an installer rip you off by more than doubling the actual system cost, then you are a sucker, in any state.

  • Nathanael

    Unfortunately, the numbers by state obscure the differences between (for example) New York City and Buffalo.

  • J. C.

    I kind of think the numbers are skewed when you consider in Mo. (if you are in Amerens market area) you can get a $2.00 per watt rebate + the 30% tax credit. At 10,000.00 watts the rebate is $20,000.00. Add in the tax credit and the payback is about 2 years with a $32,000.00 system.

  • Pingback: 9 Suprising Things about People Who Go Solar (Infographic) - CleanTechnica

  • Carrie

    I love the graphics; unfortunately it shows that in WI we can’t actually afford to go solar. My husband (an engineer) and I have tried for years to figure out how to dish out the roughly $20,000 to install a solar system in our home; as our kids are growing up and we are expecting our family dynamics to change, requiring a much smaller footprint within the next 4-5 years, I can’t justify the expense on a home we won’t retain. Any ideas on how to make it less expensive would be greatly appreciated.

    • Bob_Wallace

      Look at the cost of installation in other states. Some are half the WI price.

      Is that solely due to state/local subsidies? I doubt it. Most likely it’s because you don’t have a mature installation industry and the few companies in the business are charging more than what companies could get away with in other states.

      Consider being your own solar contractor. It ain’t rocket science. (I’ve done three residential installation and I’m definitely only DIY.)

      If you and your husband are not the DIY types you can still hire roofers (they’ve got the equipment and insurance) to install the panels and an electrician to do the hookup.

      You can purchase a solar system (less mounting racks) for under $2/Watt for thin film and under $3/watt for silicon panels. A 3kW silicon panel system for about $7,000.

      I’d bet you could put in a 3kW system for less than $10k.

      http://www.sunelec.com/index.php?main_page=systems_grid_tie

      Furthermore, installed solar generally increases the resale cost of houses over and above the price of the solar system. At least for California houses.

      http://www.cleanenergyauthority.com/solar-energy-news/study-says-solar-adds-value-to-home-042111/

      • Brewski

        Is that 3kW per hour, day, week or what?

        • Bob_Wallace

          It’s the system size, 3 kW.

          The output will depend on the amount of sunshine you get in your local area. Most of the ‘lower 48′ gets 4.5 average solar hours per day or better, so an average daily output would be 13.5 kWh per day or more.

          It’s a year later. Prices are down.

          • Martin

            Your learning bob, but grid solar system are poor at returning the full amount of energy that the PV generate, Mark.W proved that in a test. Given if you have 3kw generation of dc energy of that would only amount to 2100 watts on a good day.

        • Ashraf Abolnoor

          The power Unit measure in kw,,,,the energy unite measure in kwh,,Bob is right.

  • http://twitter.com/Dulaney_Solar Harry

    Awesome infographics, thank you!:)

Back to Top ↑