

UTArlington natural gas padsite is south east of this TCEQ Air Monitor station pictured in the forefront here.

Note in the northwest quadrant is the TCEQ air monitor…it is under the words “Southdale Dr”.
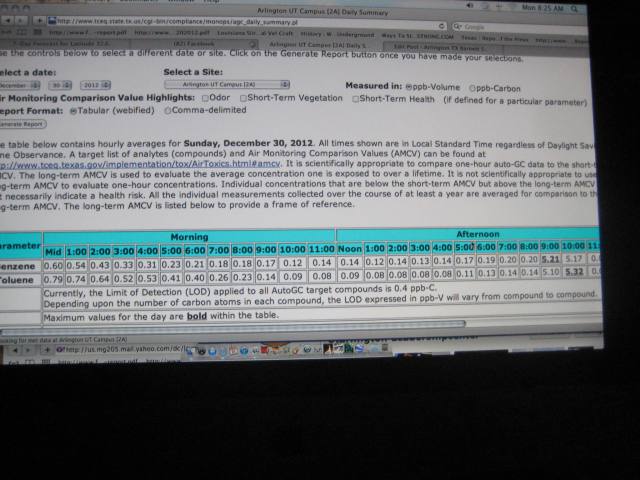
Here is the link to the TCEQ daily readings…. http://www.tceq.state.tx.us/cgi-bin/compliance/monops/agc_daily_summary.pl
And below is a TCEQ wind rose that shows for Jan-Dec what percentage and what mph historically trends in which direction..you can see that winds come from the south mostly. So for example it is a greater chance that you would be down wind if you are north of the storage tanks.

In looking at January thru September 24th 2014, I found that on August 3 2014, at 4 am we had Benzene jump to 3.25 ppb and at 5 am 1.61 ppb…

Dec 23 2013 UTA Arlington Gas Production Site Benzene spiked to 4ppb…


note winds at 8 pm were coming from the east (straight to the air monitor) at 9 pm the winds were ESE (the storage tanks and lift compressors are ESE of the monitor), and 10 pm the winds were again coming out of the east and by 11pm the winds started coming out of the E slightly NE. Emission event seems to have lasted two hours. I called TCEQ Dec 30 2013 and TCEQ came out and investigated on complaint #192908 THIRTY DAYS LATER on Jan 30 2014 and found no violations.
UPDATE for TCEQ response on Dec 23 2013 Benzene spike…
—– Forwarded Message —–
From: kim feil <kimfeil@sbcglobal.net>
To: “jerrylewis@uta.edu” <jerrylewis@uta.edu>; “cjohnston@EnerVest.net” <cjohnston@EnerVest.net>
Cc: “cynthia.simmons@arlingtontx.gov” <cynthia.simmons@arlingtontx.gov>; “don.jakeway@arlingtontx.gov” <don.jakeway@arlingtontx.gov>; “trey.yelverton@arlingtontx.gov” <trey.yelverton@arlingtontx.gov>; “robert.cluck@arlingtontx.gov” <robert.cluck@arlingtontx.gov>; Robert Rivera <robert.rivera@arlingtontx.gov>; “robert.shepard@arlingtontx.gov” <robert.shepard@arlingtontx.gov>; Michael Morgner <mgmorgner@gmail.com>; “charlie.parker@arlingtontx.gov” <charlie.parker@arlingtontx.gov>; “jimmy.bennett@arlingtontx.gov” <jimmy.bennett@arlingtontx.gov>; “lana.wolff@arlingtontx.gov” <lana.wolff@arlingtontx.gov>; “sheri.capehart@arlingtontx.gov” <sheri.capehart@arlingtontx.gov>; “kathryn.wilemon@arlingtontx.gov” <kathryn.wilemon@arlingtontx.gov>; “don.crowson@arlingtontx.gov” <don.crowson@arlingtontx.gov>; “jay.white@arlingtontx.gov” <jay.white@arlingtontx.gov>; “jim.parajon@arlingtontx.gov” <jim.parajon@arlingtontx.gov>
Sent: Wednesday, May 14, 2014 8:33 AM
Subject: {NCTCA} 4 ppb on campus Benzene not acceptable!!!!!
Ref TCEQ complaint #192908 UTA on campus gas production site
H O M E – R U L E laws need to kick in and override the state because A R L I N G T O N residents and students A R E being exposed!!
Figure it out what it takes to keep the B E N Z E N E out of our airshed !!!!!!!!!!!!!!!!!!!!!!!!!!!!!!!!!!!!!
There is no safe exposure level to Benzene p e r i o d.
The contact for the new owner of this Carrizo sold facility is Chuck Johnson (Enervest )HSE Supervisor at 817 441 5844
Jerry once again I ask for your help…I never did get follow up on my last request from you.
From: kim feil <kimfeil@sbcglobal.net>
Sent: Sunday, May 11, 2014 11:54 PM
Subject: Re: Fracking Research
See below ….also I got a TCEQ followup on a Dec 23 2-4 ppb Benzene reading from the air monitor from 9-10pm …
1) it took them 30 days to come out
2) They didn’t know Carrizo sold it
3) Enervest sad nothing out of the ordinary occurred that may have caused an upset
4) Someone was manning it that night too (got exposed)
5) in all 48 complaints for this site to date
—– Forwarded Message —–
From: Sabrina Habib <shabib@uta.edu>
To: kimfeil@sbcglobal.net
Sent: Thursday, May 8, 2014 2:37 PM
Subject: Fracking Research
Kim,
I found your blog, and youtube channel through a google search. I am a professor at UTA and started a research project about perceptions and experiences with fracking.
To participate in my research the person has to:
- have been personally affected by fracking in some way (positive or negative), and
- consent to a video recorded interview that will last about an hour
Please let me know if you or someone you know wants to participate in my study.
Thank you for your time and consideration.
Sabrina
–
Sabrina Habib, MFA, Ph.D.
Assistant Professor
Dept. of Communication
University of Texas at Arlington
shabib@uta.edu
END May 2014 UPDATE
March 22, I noticed a workover rig up on campus and this is like the third or fourth new casing replacement I think they are doing because I see these tall black pipes standing up..I took pics of that once before.
Here is a copy of my TCEQ complaint…they don’t keep 5 minute intervals..oh well.
Dear TCEQ
December 23, 2013
Approximate time observed 21:00
Address or location where the problem is occurring 100-130 Southdale Dr Arlington, TX 76010 on UTArlington TX campus at padsite of natural gas/compressors
Nearest city or town Arlington
County where the problem is occurring Tarrant
Who or what you believe is the source of the problem emission event detected
A brief description of the problem The TCEQ permanent air monitor detected Benzene spiking to ave of 2 to 4 ppb from 9pm and 10 pm while wind speeds were helping to disperse at between 4-6 mph…with resultant wind directions coming from the north (when padsite is to the SE of the monitor) could mean extremely higher ppb was released and blown south of the padsite away from monitor so we do not know how much higher the Benzene really was. Soil and nearby creek water testing is recommended south of the site. Please pull monitor record and view the 5 minute intervals before they were averaged, thanks.
Your Name Kim Feil
UPDATE TCEQ wrote back that
“The Automatic Gas Chromatograph (Auto GC) reports a concentration on an hourly basis. It collects a composite sample over a 40-minute period. The last 20 minutes is used to complete the analysis report and to bake the column and system out so there will be no carry-over contamination in the next sample. For example, when the Auto GC reports out a concentration at 11:00, it means that a composite sample was collected from 11:00 – 11:40 and the system was flushed out and baked out from 11:40 – 12:00.”
UPDATE>>>I admit I haven’t yet looked at all the daily readings since August, but when temps cooled down, I spot checked on Nov 10 and yesterday (Dec 2, 2013) and here is what I have to report on the highest average detects of each day…..keep in mind that 1.41 ppb is the longterm TCEQ Benzene Effect Screening Level threshold (exceedance)….
From 12/2/13 starting at 6pm-1am of 12/3/13, the average 8 hour Benzene reading was 1.13 ppb. http://classic.wunderground.com/history/airport/KGPM/2013/12/2/DailyHistory.html?req_city=NA&req_state=NA&req_statename=NA&MR=1 shows that the Wind Speeds were mostly calm in this time span when the Benzene spiked.
But winds were also calm during the 4:30 am – noon timeframe without Benzene spiking, but the difference being the Barometric Pressure.
So to recap I’m noting that calm winds with low to no Barometric Pressure, and colder temps make a great snuggle time with BenZene of the Barnett Shale who now has his own facebook page.

Nov 10 2013 showed from 8pm to midnight that Benzene averaged 1.03 ppb. Wind speed averaged .6 mph and the direction averaged ESE (120 nautical). If the winds were coming from between 140-160 nautical (southeast), then that would better match up to what is really coming off the storage tanks and the lift compressors.
Nov 11 2013, the top Benzene reading was 1.07 at midnight in .9 mph winds and 99 nautical direction….but alas the monitor was taken down for 9 hours and so I can’t give you any averages for benzene spikes for a longer duration….TCEQ said it was maintenance related.
The UTArlington pad site has 22 gaswells and two lift compressors that have blow down maintenance (emission events where they release raw gases). But how many “planned” blowdowns are we made to co-exist with? FYI an unplanned emission event is an emergency shutdown from a loss of power or any related equipment failure.
Well per a Carrizo rep (at a Pantego city hall testamony in Dec 2012 in referring to the electric “urban” lift compressors)…about every 90 days.
Chesapeake said as often as monthy per a PIR for the GM compressors.
By Lake Arlington, Handley’s 2007 Compressor Blowdowns notes read that they have… “60 blowdowns/yr
(approx one blowdown a week) per compressor … assumes .25 hour per blowdown”.
———–END UPDATE————
So in regards to this UTA padsite, complete with a TCEQ installed adjacent air monitor. I figure it is positioned so that specific downwind readings (for the storage and lift compressors) occur when the winds are coming from roughly the southeast. Of course in high winds, dispersion is rampant and pollution fall out is only ….God knows where.
Note update of Aug 9 2013 Benzene reading have been exceptionally better than last year and thru Feb 11th of 2013. This is probably due to the casing? work replacement in late Feb 2013. Nahh…. update Nov 12 2013…when the winds die down and now that the temps R colder…Benzene is spiking past the 1ppb.
I made a huge fuss at year end because of some unusually high Benzene readings over 5 ppb (see pics below) that TCEQ said was an air monitoring operator error.
Last February in 2013 a job was posted to Craigslist for an on campus storage tank babysitter at $54K a year, and so my ranting at year end may have helped “spark” that job creation thang albeit one job and possibly a boost to the oncology business sector for this poor soul accepting that job.
One thing I’ve noticed back June & July of 2013 is that when the winds die down to about 1/2 mph, that the Highest Benzene Daily Reading exponentially increases from a .17 ppb *TCEQ stated ave and jumps to about .4 ppb now. Contrast that to Jan & Feb of 2013 when the winds were averaging 1/2 mph, the Benzene was averaging 1.3 ppb. This is a 70% improvement in decreasing Benzene emissions in low winds….thanks to all who helped fix this problem….Mother Nature in warmer weather? Or repairing leaks?
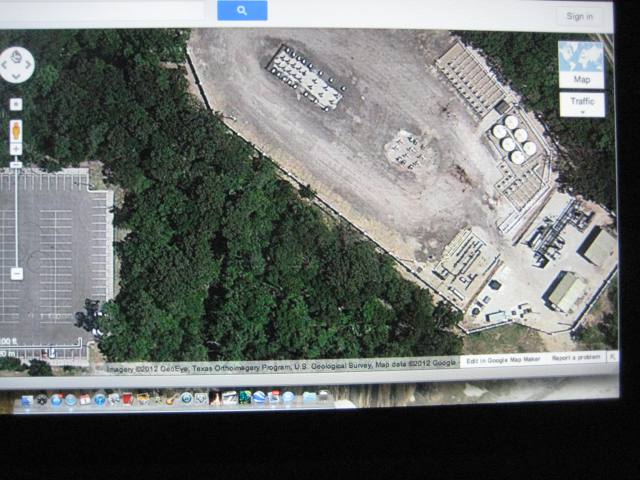
Above is an aerial shot of the UTA Johnson Creek Crossing student housing parking lot in the southwest quadrant near the Carrizo natural gas plant at 1101 S Pecan in Arlington TX located on campus. Unknown is the formaldehyde and carbonyl sulfide emissions as well as methane that the state air monitors do not capture, but in viewing an internet rating blog of the student housing, you may want to read this blog as some of the comments may indicate the students being exposed to unidentified odors.
When the winds aren’t whipping and the temp is low, Benzene likes to linger because moist and cold air extends the duration of the chemical reactions that occur at a slower rate.
http://earthobservatory.nasa.gov/IOTD/view.php?id=80200 states…..
“In most times of year, the air higher in the atmosphere is cooler than the air near the ground, allowing warm air to rise and carry pollution up and away from its source. But in the winter, temperature “inversions” can form, where the air near the ground is cooler than the air at altitude. Polluted surface air rises a bit, but then runs into warmer air masses above and stays trapped near the surface.”

Pictured is the UTA 1/16/2013 Benzene spike during cold and calm winds…
12/12 1.45 ppb midnight .6 mph 270
A 13 consecutive hour record was set (since this monitor has gone online). From 6 pm on 11/20/2012 through 7 am on 11/21/2012, Benzene averaged 1.4 ppb at .5 ave wind speed which makes this 99% of the long term Effect Screening Level (ESL of 1.41 ppb). Note “my” consecutive 13 hour exposure concern is not considered “long term- one year”, and so the state will not look into things unless the ppb gets to 90 ppb*
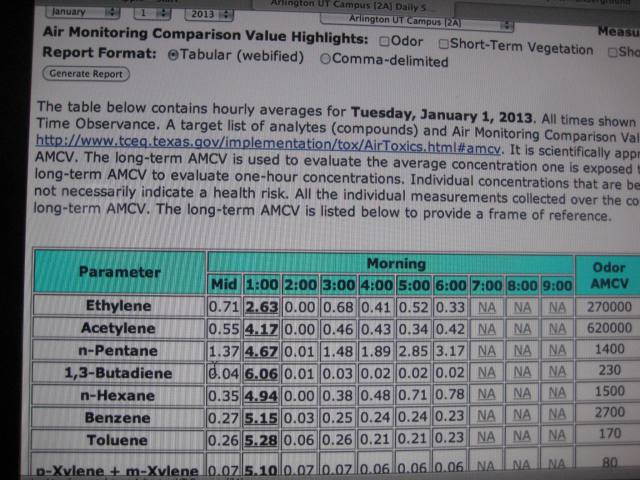
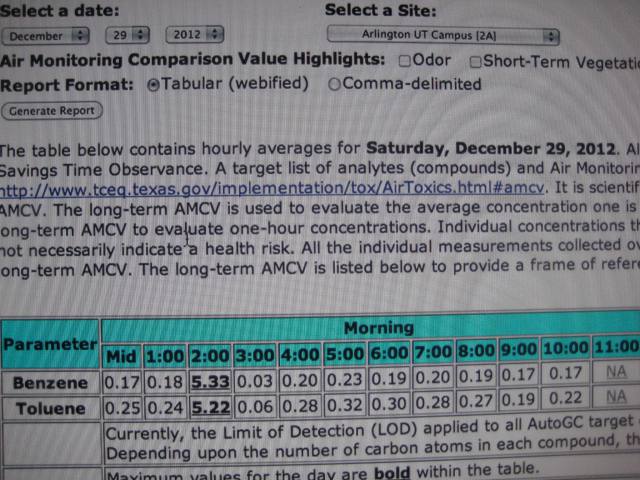
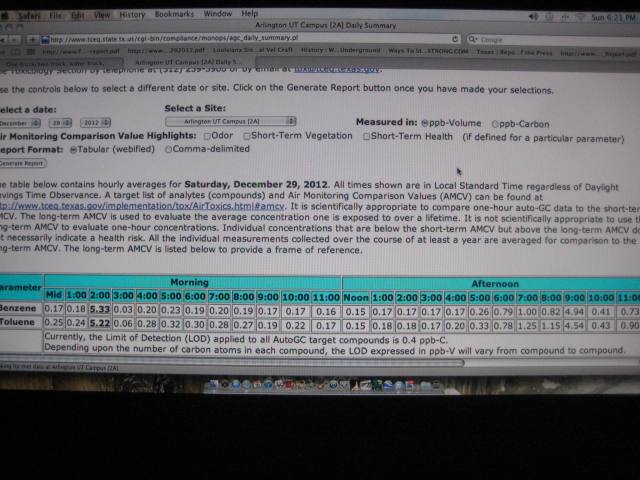
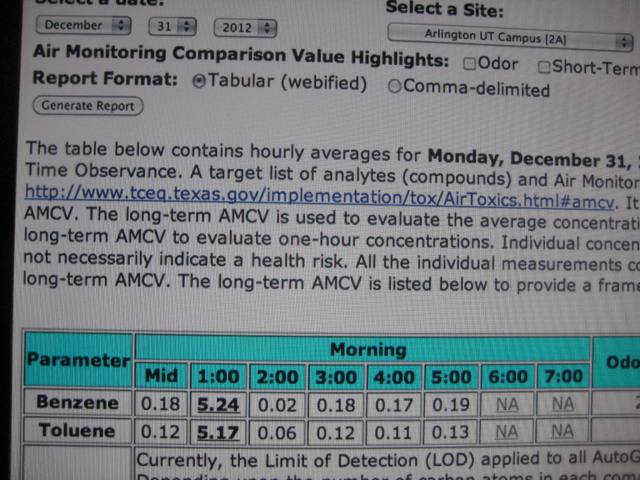
TCEQ confirmed malfunction of wind vane and operator coding ppb error of air monitor for BTEX and other related items being screened from 12/29 thru 1/1/2013 >>>Wind and calibrating times are malfunctioned? Suspect though in the first picture is that only eight or nine (mostly BTEX related) of the 70 items being screened have been spiking though. Update-TCEQ claims that 55 components are tested differently (ie the IQ code) which should explain why not “all” items being screened had spikes/operator coding errors. Wouldn’t all 70 be spiking too if truly malfunctioning? FYI Jan 2 yielded no spikes or calibration at 1 or 2 am.
There are two photos for 12/29 to show the 2 am and 9pm activity. If you go to this link, you will find that those dates are now “fixed” to show acronym coding http://www.tceq.state.tx.us/cgi-bin/compliance/monops/agc_daily_summary.pl
Here is a statement from Jenny from the NCTCOG responding on behalf of the TCEQ…..
Jenny
I called 911 and asked them to do methane readings on New Years Eve (risk of illegal fire works) because of the Benzene spikes. Here is the video below where the confusion of the request landed 911 on my doorstep (911 was at the wrong place- at the wrong time) UPDATE …. on my Open Records Request..” I am requesting the dispatch and LEL readings to the UTA drillsite as requested on New Years day to take readings at New Years Eve night at 9-10pm and again at 1-2am due to UTA air monitor high Benzene reading trends starting on Dec 29.” Just as I thought…. no information…
| W010057-010313 | Open Records Request | No Records Exist | 1/8/2013 | 1/3/2013 |
This link shows they (UTA) care about being sustainable, but hey 22 on campus gaswells contradicts that. http://live.deckmonitoring.com/?id=ut_arlington_parking_garage
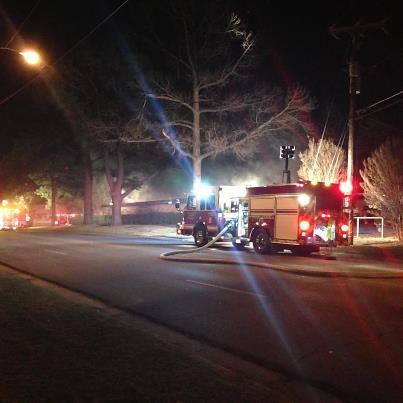
Pic of the Arlington clinic fire near UTA late Dec 3 at 206 E. Mitchell St. (Credit: Nick Nonan)
Hydrocarbons at the UTA drill site spiked on average 95% across the board in all pollutants being screened for on the midnight readings of 11/21/12 (compared to the trending midnight readings like on 11/22), we know we don’t need any sparks from nearby fires when these “spikes” occur…. B O O M….?
For manual TCEQ investigations by suma canister visit http://www.tceq.texas.gov/toxicology/barnettshale/samplingresults

thanks, Kim, for a good article outlining the air emissions health impacts on residents near gas drilling– this is a real concern and needs publicity and action.