

Renewable Energy = 68% of New Electricity Capacity In September


November 2nd, 2014 by Zachary Shahan
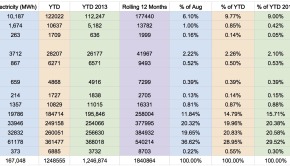
The latest monthly numbers on electricity production capacity additions have been released by FERC. The result is another big month for renewable energy… and natural gas. As you can see in the first chart above, wind power accounted for the majority (61%) of new power capacity. Natural gas accounted for 19%, nuclear 12%, and solar 7%.
For the year to date, natural gas has accounted for 58% of new electricity production capacity, utility-scale solar 19%, wind 18%, and nothing else more than 2%. Together, renewables account for nearly 41% of all new capacity added in the first three quarters of 2014.
In total, the picture looks much worse (of course). 42% of US electricity production capacity comes from natural gas, 28% from coal, 9% from nuclear, 8.5% from water, 5% from wind, 4% from oil, and ~1% each from biomass and utility-scale solar.
But there is reason for hope. As the SUN DAY campaign noted in an email sent to CleanTechnica, “new capacity in 2014 from the combination of renewable energy sources thus far is almost 35 times that of coal, oil, and nuclear combined (3,598 MW vs. 104 MW).” Going on: “For the month of September alone, renewables accounted for over two-thirds of the 603 MW of new generating capacity put in-service [367 MW of wind (60.86%) plus 41 MW of solar (6.80%)].” The first three quarters of 2014 saw 11.8% more renewable energy capacity compared to the same period in 2013 (3,598 MW vs. 3,218 MW). We’re getting going. Things need to speed up, but I’m confident they will. Furthermore, here’s one more reminder that rooftop solar power is not included in these figures.
Check out more CleanTechnica reports.

Keep up to date with all the hottest cleantech news by subscribing to our (free) cleantech newsletter, or keep an eye on sector-specific news by getting our (also free) solar energy newsletter, electric vehicle newsletter, or wind energy newsletter.
Google+
About the Author
Zachary Shahan spends most of his time here on CleanTechnica as the director/chief editor. Otherwise, he's probably enthusiastically fulfilling his duties as the director/editor of Solar Love, EV Obsession, Planetsave, or Bikocity. Zach is recognized globally as a solar energy, electric car, and wind energy expert. If you would like him to speak at a related conference or event, connect with him via social media. You can connect with Zach on any popular social networking site you like. Links to all of his main social media profiles are on ZacharyShahan.com.
Related Posts
October Electric Car Sales Report (US) →
Wiki-Solar Claims Global Utility-Scale PV Capacity Passed 30 GW →
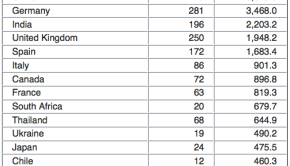
Australia Falls Out Of The Top 15 Utility-Scale Solar Countries →
Renewable Energy = 10% of US Electricity Generation In August →
-
bmarcoux
-
Bob_Wallace
-
bmarcoux
-
Bob_Wallace
-
-
-
-
http://zacharyshahan.com/ Zachary Shahan
-
Michael G
-
http://zacharyshahan.com/ Zachary Shahan
-
-
Ron Winton
-
Wayne Williamson
-
Wayne Williamson
-
Larmion
-
Ronald Brakels
-
Larmion
-
Ronald Brakels
-
Bob_Wallace
-
-
-
-
-
Marc Dorwitt
-
Larmion
-
Marc Dorwitt
-
-
-
Senlac
-
http://zacharyshahan.com/ Zachary Shahan
-
-
Steve N
-
http://zacharyshahan.com/ Zachary Shahan
-