

Top Wind Power Countries Relative to Electricity Production (CleanTechnica Exclusive)


June 5th, 2012 by Zachary Shahan
Closing out this series (I think), below are the top countries in the world* for wind power capacity relative to electricity production**. In other words, these are the countries that have the most wind power compared to their electricity production.
This post follows posts on top wind power countries per capita and top wind power countries per GDP. All three of these posts will soon be included in the Wind Power resource page we have featured on the side of our website.
While the Global Wind Energy Council (GWEC) provides an invaluable (in my opinion) annual report on total and new wind power in countries around the world (see GWEC’s most recent annual report or our summary of it), I have often wished I had information and rankings on wind power per capita, per GDP, and relative to total electricity production — hence this series. This last ranking is the most important for me, as it actually shows (better than the others at least) how much of a country’s electricity is coming from wind power. I hope you find it as interesting and useful as I do.
(Note to those who I know will bring this point up: I realize that MW and MWh are two different things, but without comprehensive figures on MWh by country, and with the general assumption that efficiency of installed wind power will be similar around the world, I think this is a very good method for determining the relative prominence of wind power in these countries’ electricity production systems.)
Takeaway Points
A few key points you’ll be able to identify in the charts and lists below are:
- Cape Verde is a total winner when it comes to wind power per TWh of electricity production. (Note, however, that Cape Verde’s population is just under half a million and it generates a lot less electricity than the other countries on the list. Still, though, this is about leadership in highly important relative terms.)
- Denmark, as is commonly known, is a leader in wind power as a portion of its electricity system (even if it no longer shows up on the top 10 list for installed wind power in absolute terms). This ranking confirms that leadership.
- Portugal is not only a world leader in wind power in absolute terms (it was in the top 10 for cumulative installed wind power capacity at the end of 2011), but it is also a leader in wind power relative to total electricity production.
- Spain, India, Germany, Italy, the UK, and Sweden also do fairly well in both forms of measurement.
- China is actually doing well in both absolute wind power additions (#1 in 2011, by far) and wind power additions relative to electricity production (#8 in 2011, or #7 if you removed Cape Verde from the list).
- The US and France, while leaders in absolute wind power capacity, don’t fare so well when that is compared to total electricity production.
But, there’s more to see. On to the rankings (3 sections below):
Top Countries for Total Installed Wind Power (End of 2011) per TWh of Electricity Production
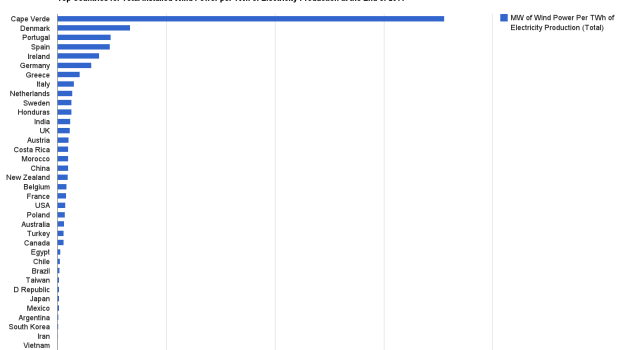
As was the case in new wind power per GDP, Cape Verde steals the show. For this reason, I am presenting two charts below, one with Cape Verde included and one without Cape Verde included, so that you can get a better sense for how the other countries compare. Following the two charts is a list of the top 20 countries (with the specific figures included).

Top wind power countries relative to electricity production. (To enlarge, click on the image and then click on it again on the next page.)

Top wind power countries relative to total electricity production (not including Cape Verde). (To enlarge, click on the image and then click on it again on the next page.)
Top 20 countries for total cumulative installed wind power relative to electricity production (MW of installed wind power per TWh of electricity production):
- Cape Verde — 533.33
- Denmark — 110.28
- Portugal — 73.17
- Spain — 72.15
- Ireland — 57.63
- Germany — 46.80
- Greece — 30.62
- Italy — 22.59
- Netherlands — 20.28
- Sweden — 19.11
- Honduras — 19.10
- India — 17.44
- UK — 17.16
- Austria — 15.31
- Costa Rica — 14.99
- Morocco — 14.93
- China — 14.83
- New Zealand — 14.35
- Belgium — 12.80
- France — 11.86
The US was #21 at 10.85 MW of wind power per TWh of electricity production.
Top Countries for Newly Installed Wind Power (2011) per TWh of Electricity Production
Again, Cape Verde is such an outlier that I’ve included two charts (one with it and one without it), followed by the top 20 list.

To enlarge, click on the image here and then click on it again on the next page.

To enlarge, click on the image here and then click on it again on the next page.
Top 20 countries for new wind power capacity in 2011 relative to electricity production (MW of wind power per TWh of electricity production):
- Cape Verde — 511.11
- Honduras — 19.10
- Ireland — 8.45
- Portugal — 6.76
- Greece — 5.85
- Sweden — 4.91
- Denmark — 4.61
- China — 4.19
- Spain — 3.50
- UK — 3.39
- Germany — 3.36
- India — 3.27
- Italy — 3.19
- Poland — 2.77
- New Zealand — 2.51
- Belgium — 2.28
- Dominican Republic — 2.26
- Turkey — 2.24
- Canada — 2.01
- USA — 1.57
Top 10 Countries for New and Cumulative Wind Power Capacity (Absolute Numbers)
And, again, here’s GWEC’s charts on the top wind power countries in absolute terms (not relative to electricity production):

*As noted in the preceding posts, while the Global Wind Energy Council (GWEC) puts together the most comprehensive report on installed wind power by country, it doesn’t include installed wind power details for each of the countries of the world. In particular, countries with little or no installed wind power are not included. Since I used the information provided in GWEC’s annual report for the rankings above, the rankings are not based on a comprehensive examination of wind power per electricity production for all countries of the world. Unfortunately, this might mean that some small countries with small amounts of wind power but also very small amounts of electricity production (that would presumably rank well above) are not on the list — I’m not sure if such countries exist or not, but I would guess that there are some, perhaps even some that would give Cape Verde a run for its money!
**Source of electricity production figures (retrieved June 4).
Keep up to date with all the hottest cleantech news by subscribing to our (free) cleantech newsletter, or keep an eye on sector-specific news by getting our (also free) solar energy newsletter, electric vehicle newsletter, or wind energy newsletter.
Google+
About the Author
Zachary Shahan spends most of his time here on CleanTechnica as the director/chief editor. Otherwise, he's probably enthusiastically fulfilling his duties as the director/editor of Solar Love, EV Obsession, Planetsave, or Bikocity. Zach is recognized globally as a solar energy, electric car, and wind energy expert. If you would like him to speak at a related conference or event, connect with him via social media. You can connect with Zach on any popular social networking site you like. Links to all of his main social media profiles are on ZacharyShahan.com.
Related Posts
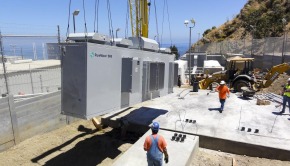
Energy Storage Will Replace Many Peaker Spinning Reserve Plants →

Tesla Prepares For Australian Launch Of Model S →
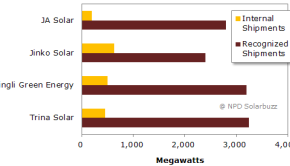
Solar Manufacturers Doing More Business In-House →


Pingback: Solar & Wind Energy Overview −Solar Love!
Pingback: Martian Microbes, Wind Energy & the Great Pacific Garbage Patch: Link Party
Pingback: Link Party #18: Wind Power, Plastic Trash, and Food Trucks that Do Good
Pingback: Top Solar Power Countries (Per Capita, Per GDP, Per TWh of Electricity Produced, & in Total) - CleanTechnica
Pingback: Top Wind Power Countries Per Capita (CleanTechnica Exclusive) - CleanTechnica
Pingback: Top Wind Power Countries Per GDP (CleanTechnica Exclusive)