

Top Wind Power Countries Per Capita (CleanTechnica Exclusive)


June 4th, 2012 by Zachary Shahan
What are the top countries in the world for wind power, per capita? Take a look below!
I’ve been meaning to get to this for awhile, but hopefully that means the data have just gotten better since I first intended to put this together.
The Global Wind Energy Council (GWEC) does a great job of summarizing wind power growth and cumulative installed wind power capacity in countries around the world year after year. And we wrote a summary piece on GWEC’s most recent annual report when it came out in February. However, GWEC’s report always looks at these numbers on an absolute basis. While that is very relevant to many discussions, I often want to know what the top countries are per capita, per GDP, and per GWh or TWh of electricity production. So, I’ve gone and figured those things out (not difficult, of course, just requires setting a little time aside from the fast-paced, jam-packed news cycle I’m usually on in order to do so).
This first post in this series looks at newly installed wind power per capita and total cumulative installed wind power per capita. (And, yes, this post and the coming two will be added to our Wind Power resource pages linked/featured on the side of our website.)
–>Update: the Top Wind Power Countries per GDP and Top Wind Power Countries per TWh of Electricity Production posts have now been published.
One limitation of the numbers below is that GWEC doesn’t include wind power figures for all the countries of the world. Nonetheless, it includes all the big ones (when it comes to wind power) and the list is as comprehensive as any I am aware of. One other limitation is that population figures used in the calculations were not from one source nor from one point in time — they were the most recent figures available for each country and were retrieved via Wikipedia. But, even if the population numbers were from the same source and point in time, I think the results and rankings would be more or less the same anyway — the more important figures to have standardized in these calculations are the MW of installed wind power.
Anyway, with those notes aside, here are the top countries in the world for:
- Cumulative installed wind power per million people (end of 2011) and
- Newly installed wind power per million people (2011)
- Followed by GWEC’s charts on the absolute leaders in these categories
Top Countries for Cumulative Installed Wind Power per Million People (End of 2011)

To enlarge, click on the image and then click on it again on the next page.
In case anyone happens to have trouble with images or want more specific figures, the top 20 countries (above) for MW per million people are:
- Denmark — 693.14
- Spain — 469.28
- Portugal — 386.59
- Ireland — 355.47
- Germany — 355.00
- Sweden — 312.79
- Canada — 151.22
- Greece — 151.01
- USA — 149.58
- New Zealand — 140.56
- Netherlands — 139.10
- Austria — 128.24
- Italy — 113.29
- UK — 105.04
- France — 104.06
- Belgium — 98.44
- Australia — 97.02
- Cape Verde — 48.79
- China — 46.29
- Poland — 41.97
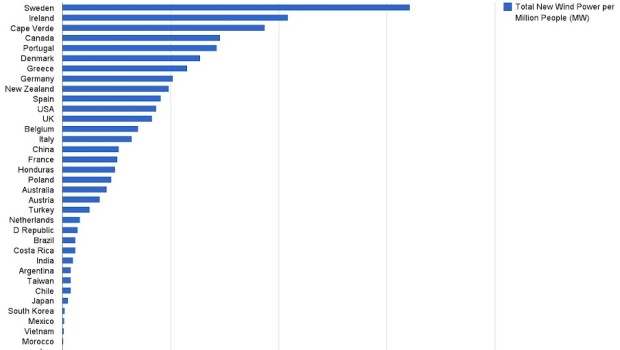
Top Countries for Newly Installed Wind Power per Million People (2011)

To enlarge, click on the image and then click on it again on the next page.
Again, in case you want more detail or can’t view images for some odd reason (it can happen), here are the top 20 for newly installed wind power (in MW) per million people:
- Sweden — 80.36
- Ireland — 52.09
- Cape Verde — 46.76
- Canada — 36.39
- Portugal — 35.70
- Denmark — 31.87
- Greece — 28.83
- Germany — 25.48
- New Zealand — 24.60
- Spain — 22.73
- USA — 21.71
- UK — 20.77
- Belgium — 17.53
- Italy — 15.98
- China — 13.09
- France — 12.70
- Honduras — 12.16
- Poland — 11.32
- Australia — 10.21
- Austria — 8.63
Top 10 Countries for New and Cumulative Wind Power Capacity (Absolute Numbers)
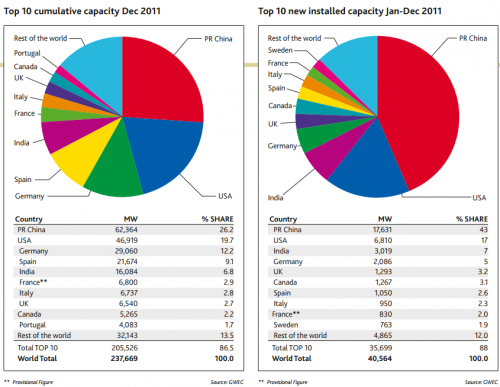
As you can see by comparing the above charts, the US and China dominate when it comes to absolute MW of wind power (new and total), but they are quite mediocre when installed wind power is compared to population.
Denmark, Spain, Portugal, Ireland, Germany, and Sweden continue to dominate when it comes to total installed wind power per capita, while the top countries in new installation capacity per capita in 2011 were Sweden, Ireland, Cape Verde(!), Canada, Denmark, Greece, and Germany.
Stay tuned for wind power leaders per GDP and per electricity production — there are some bigger surprises coming.
Keep up to date with all the hottest cleantech news by subscribing to our (free) cleantech newsletter, or keep an eye on sector-specific news by getting our (also free) solar energy newsletter, electric vehicle newsletter, or wind energy newsletter.
Google+
About the Author
Zachary Shahan spends most of his time here on CleanTechnica as the director/chief editor. Otherwise, he's probably enthusiastically fulfilling his duties as the director/editor of Solar Love, EV Obsession, Planetsave, or Bikocity. Zach is recognized globally as a solar energy, electric car, and wind energy expert. If you would like him to speak at a related conference or event, connect with him via social media. You can connect with Zach on any popular social networking site you like. Links to all of his main social media profiles are on ZacharyShahan.com.
Related Posts
Energy Storage Will Replace Many Peaker Spinning Reserve Plants →

Tesla Prepares For Australian Launch Of Model S →
Solar Manufacturers Doing More Business In-House →


Pingback: Solar & Wind Energy Overview −Solar Love!
Pingback: Top Solar Power Countries (Per Capita, Per GDP, Per TWh of Electricity Produced, & in Total) - CleanTechnica
Pingback: Wind Power Compared to Electricity Production: Top Countries (CleanTechnica Exclusive)
Pingback: Top Wind Power Countries Per GDP (CleanTechnica Exclusive)
Pingback: Wind power winners: the top 20 countries per capita - reneweconomy.com.au : Renew Economy