Petroleum & Other Liquids
This Week in Petroleum
Release date: Oct. 29, 2014 | Next release date: Nov. 5, 2014
Download data | Past Weeks in Petroleum | Release schedule | Print
U.S. average retail regular gasoline price near $3 per gallon
At the beginning of this week, the U.S. average retail price for regular gasoline was $3.06 per gallon (gal), $0.64/gal lower than the June average price and the lowest average price for any week since December 2010. Falling crude oil prices have been largely responsible for the decline in retail gasoline prices. Typical seasonal declines in gasoline crack spreads, the difference between the wholesale price of gasoline and the crude oil price, have also contributed to falling pump prices. Current market prices and conditions indicate that a U.S. average retail price below the symbolic $3/gal mark is possible in the coming weeks.
EIA’s survey is consonant with survey results reported by AAA, which cited an average regular grade gasoline price on Monday of less than $3/gal at 55% of U.S. stations. GasBuddy.com also reported early-week prices of just over $3/gal.
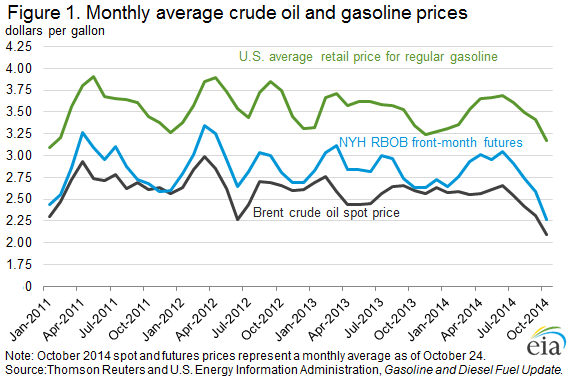
The spot price for North Sea Brent crude oil, which U.S. petroleum product prices generally track, has fallen by $24 per barrel (bbl) from the 2014 monthly-average peak of $112/barrel in June. As of October 24 the monthly average Brent spot price was $88/bbl. The $24/bbl decline in price equates to about $0.57/gal.
Brent crude oil prices have declined because of a weakening outlook for global oil demand growth, the return to the market of previously disrupted Libyan crude oil production, and continued growth in U.S. tight oil production. Brent prices are now the lowest they have been since late 2010, before violence in Libya and other areas in the Middle East and North Africa disrupted significant volumes of crude oil supply to the global market.
In addition to falling crude oil prices, easing wholesale gasoline market conditions have contributed to lower retail prices, as indicated by falling gasoline crack spreads. The gasoline crack spread is calculated as the difference between the price of gasoline for prompt delivery, represented by the Nymex futures price for reformulated blendstock for oxygenate blending (RBOB), a petroleum component that is blended with ethanol to make finished gasoline, and the Brent crude oil spot price. The gasoline crack spread has fallen by about $0.20/gal from its June level of $0.38/gal to an average of $0.18/gal in October. This year ’s crack spread decline is similar to the average June-October decline of $0.21/gal observed from 2009-13, and it reflects typical seasonal factors such as declining gasoline consumption and the switch to winter-grade gasoline.
The $0.57/gal decline in Brent crude oil price combined with the $0.20/gal decline in the gasoline crack spread has resulted in an October average wholesale gasoline price that is about $0.77/gal lower than the June price. Because U.S. average retail prices have declined $0.64/gal and because changes in the wholesale gasoline price tend to be fully passed through to retail prices with a lag, all other market factors constant, retail gasoline prices are likely to fall further in the coming weeks.
From 2009 to 2013, the spread between the U.S. average retail price for regular gasoline and the wholesale price for regular gasoline, as represented by the front-month Nymex RBOB contract, has averaged $0.68/gal. This spread typically peaks in early autumn before moving back in line with its annual average during November. On October 24, the Nymex RBOB contract for November delivery closed at $2.18/gal, leaving the retail-RBOB spread at $0.88/gal. However, without further changes to Brent crude oil prices and gasoline crack spreads, the wholesale-retail price spread could be expected to compress to a level closer to its historical average as the decline in wholesale price is passed through to retail prices. With such a change, U.S. average retail prices could move below $3/gal for the first time since December 2010.
Although U.S. average retail prices remain above $3/gal, the PADD 3 (Gulf Coast) average retail price is already well below that level, averaging $2.83/as of October 27. Gasoline prices in different regions of the country vary, because of localized supply and demand conditions, differences in gasoline quality specifications, notably those in California, and state and local gasoline taxes. Retail prices on the Gulf Coast are often the lowest in the country because the region is home to about half of U.S. refining capacity and produces much more gasoline than it consumes locally. The Gulf Coast also generally has low taxes on gasoline compared with other locations. Conversely, with relatively high tax rates and more restrictive gasoline specifications that are more expensive to produce, PADD 5 (West Coast) average prices are often the highest in the country. The average retail price on the West Coast was $3.32/gal on October 27. Additionally, while prices have been falling across most of the country, some areas have experienced increasing prices. These areas include the upper Midwest, where gasoline supplies have been reduced because of unplanned refinery outages. The tightening supplies contributed to a $0.14/gal increase over the past week in the retail price for regular gasoline in Minnesota to an average of $3.09/gal as of October 27.
Gasoline prices lowest since 2010, diesel fuel prices mostly fall
The U.S. average price for regular gasoline fell six cents in the past week to $3.06 per gallon as of October 27, 2014, 24 cents lower than the same time last year and the lowest price since December 27, 2010. The West Coast price decreased ten cents to $3.32 per gallon, followed by the East Coast, which fell nine cents to $3.05 per gallon. The Gulf Coast was down eight cents to $2.83 per gallon, while the Rocky Mountain price decreased five cents to $3.20 per gallon. The Midwest price was down a penny to $3.02 per gallon.
The U.S. average diesel fuel price fell two cents from last week to $3.64 per gallon, 24 cents lower than the same time last year. The West and East Coast prices each fell four cents, to $3.80 per gallon and $3.63 per gallon, respectively. The Gulf Coast price fell three cents to $3.56 per gallon, while the Rocky Mountain price declined two cents to $3.71 per gallon. The Midwest price increased half a cent to $3.61 per gallon.
Propane inventories fall
U.S. propane stocks decreased by 1.3 million barrels last week to 80.3 million barrels as of October 24, 2014, 15.5 million barrels (23.9%) higher than a year ago. Gulf Coast inventories decreased by 0.7 million barrels and Midwest inventories decreased by 0.5 million barrels. East Coast inventories decreased by 0.2 million barrels while Rocky Mountain/West Coast inventories remained unchanged. Propylene non-fuel-use inventories represented 2.7% of total propane inventories.
Residential heating oil price decreases while residential propane price increases
As of October 27, 2014, residential heating oil prices averaged $3.45 per gallon, almost 3 cents per gallon lower than last week, and nearly 37 cents less than last year’s price for the same week. Wholesale heating oil prices averaged over $2.61 per gallon, more than 3 cents per gallon lower than last week and 40 cents lower when compared to the same time last year.
Residential propane prices increased by one cent last week to just under $2.40 per gallon, almost one cent less than the price at the same time last year. Wholesale propane prices averaged nearly $1.04 per gallon, almost 4 cents lower than last week’s price and 27 cents per gallon lower than the October 28, 2013 price.
For questions about This Week in Petroleum, contact the Petroleum Markets Team at 202-586-0786.
Retail prices (dollars per gallon)

| Retail prices | Change from last | ||
|---|---|---|---|
| 10/27/14 | Week | Year | |
| Gasoline | 3.056 | -0.064 | -0.238 |
| Diesel | 3.635 | -0.021 | -0.235 |
| Heating Oil | 3.453 | -0.029 | -0.366 |
| Propane | 2.398 | 0.011 | -0.008 |
Futures prices (dollars per gallon*)

| Futures prices | Change from last | ||
|---|---|---|---|
| 10/24/14 | Week | Year | |
| Crude oil | 81.01 | -1.74 | -16.84 |
| Gasoline | 2.182 | -0.051 | -0.405 |
| Heating oil | 2.482 | -0.016 | -0.428 |
| *Note: Crude oil price in dollars per barrel. | |||
Stocks (million barrels)

| Stocks | Change from last | ||
|---|---|---|---|
| 10/24/14 | Week | Year | |
| Crude oil | 379.7 | 2.1 | -4.1 |
| Gasoline | 203.1 | -1.2 | -10.7 |
| Distillate | 120.4 | -5.3 | -2.3 |
| Propane | 80.271 | -1.341 | 15.474 |