The era of quantitative easing is over, for now, and in the United States, at least. But the consequences of the Federal Reserve’s policy to pump trillions of dollars into the financial system in hopes of stimulating the economy will long be with us.
Fed policy makers met Wednesday and announced that October would conclude their third round of using dollars created out of thin air to buy vast sums of bonds — $1.7 trillion in just the third round of the program, known across the land (or at least the financial world) as QE3.
The program has managed a rare trick of being perpetually maligned on Wall Street while driving asset prices up enough to make lots of people on Wall Street very wealthy. But what do we know about these three programs that eased monetary policy through unconventional means?
The Fed faces a paradox. Its goals are all related to the real economy. It is charged by law with maintaining stable prices and maximum employment. But its tools work through financial markets, principally buying and selling bonds.
So while the Fed’s impact on financial markets can be dramatic and easy to measure, its impact on the economy, which is the real goal, can be much squishier. Still, here’s what we know about the successes (and failures) of more than five years of Q.E.
What exactly is Q.E., anyway?
Quantitative Easing, in One Chart
In three phases since late 2008, the Federal Reserve has bought trillions of dollars in bonds using newly created money to stimulate the economy. QE3 is likely to end this month.

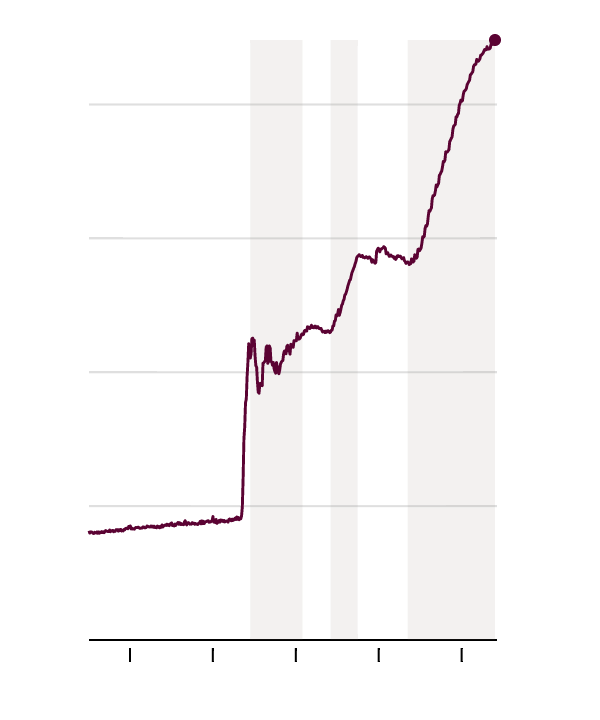
One chart shows its essence: the line showing the total size of the central bank’s balance sheet. For years, it bounced along at a nearly constant level, until the 2008 financial crisis, when the Fed began using its power to create money, first to respond to the crisis, and when the intense phase of the crisis had passed, to try to boost an economy that kept underperforming.
And it’s not going anywhere anytime soon, by the way. Janet Yellen, the Fed’s chairwoman, has indicated that the Fed will keep its large balance sheet in place for some time. When it is time to tighten the money supply, it will start by raising short-term interest rates, not by selling off some of the assets it has acquired.
Ben Bernanke, the former chairman of the Fed who engineered all three rounds of the program, drew a distinction between what he called “credit easing,” or pushing money into specific lending markets that had broken down, and “quantitative easing,” or increasing the money supply generally.
One simple way of looking at the distinction is by following the trend in what the Fed bought. Traditionally, the Fed has held almost entirely United States government bonds, buying and selling them to adjust the money supply. The idea is that they are a neutral asset, the bedrock from which other interest rates through the economy are set.
The Fed Has Bought Vast Sums of Mortgage-Backed Bonds
In its first and third rounds of quantitative easing, the Fed bought not just the U.S. government debt it has traditionally owned, but securities backed by Americans’ home mortgages.

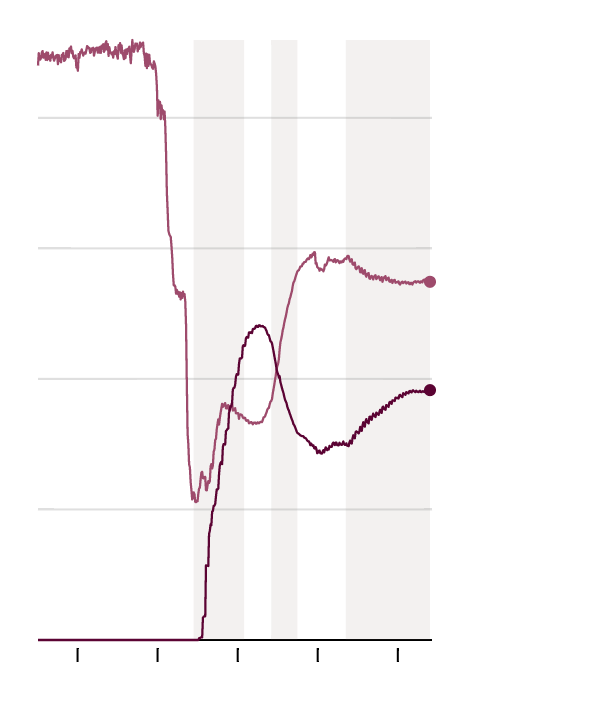
But during the first and third rounds of Q.E., the Fed has bought vast sums of mortgage-backed securities issued by government-sponsored firms like Fannie Mae and Freddie Mac, instead of just Treasuries.
Consumer and Business Borrowing Costs Have Fallen
Amid the Fed’s quantitative easing programs, interest rates for both American homebuyers and large businesses have fallen.


The idea has been to try to channel money directly toward the troubled housing market; a flood of Fed money into mortgages has contributed to lowering the premium that Americans must pay to borrow money to buy a house. If you are looking to buy a house and are surprised to learn you can get a mortgage at a rate not much higher than what the federal government pays to borrow money (that is, very low), it is reasonable to thank Ben Bernanke and Janet Yellen.
The practice remains controversial within the Fed, as it comes awfully close to picking winners and losers in the economy — in this case, favoring housing over other forms of investment.
What it has meant for markets
When the Fed took trillions in government bonds and mortgage securities off the market, the investors who would have bought them had to find something else to buy. Often the answer was corporate bonds. With the increased demand, prices of those bonds went up and the interest rate that large companies must pay to borrow money on the bond market fell. That made the environment more favorable for companies looking to expand or refinance old debts.
So both consumer and business borrowing costs fell sharply over the time the Fed’s money-creation was at full throttle.
But this rally, which has happened across a broad range of financial markets, is not without risks. While a bubble is in the eye of the beholder, it is the case that many assets — almost all the major types of assets on earth, in fact — are at the high end of their historical valuations.
Consider one common measure of the stock market, valuations, as tracked by Yale University’s Robert Shiller. It compares the valuation of the Standard & Poor’s 500 index with the inflation-adjusted earnings of companies over the preceding decade. The idea is to filter out cyclical ups and downs and assess whether stocks are expensive or cheap relative to their long-term averages.
The Stock Market Has Returned to Pre-Bust Levels
Stocks are trading at a level they previously only reached during the late 1990s stock market bubble and just before the financial crisis.
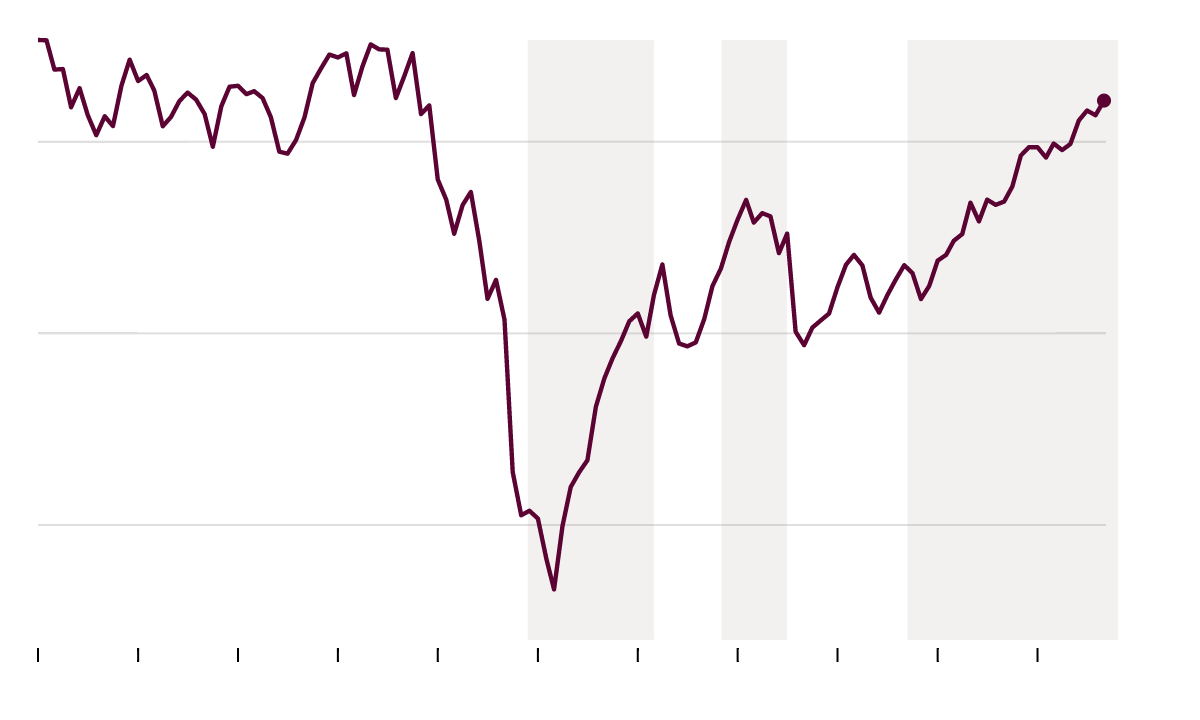

And the answer right now: They are expensive. Not quite as richly valued as during the immediate run-up to the financial crisis and nowhere near as expensive as during the late 1990s stock market bubble. But well on the high end of normal.
In other words, there is a risk that, aided by Q.E., financial markets have come back a bit too far, too fast, especially when compared with fundamentals like the amount of money companies are making.
What about inflation?
One of the most urgent reasons for the program was the fear of deflation — that, as happened in the 1930s, once prices started falling, it could become a dangerous vicious cycle that would leave millions unemployed. In early 2009, prices, especially for commodities, were in free fall.
This much can be said for Q.E.: It helped arrest that vicious cycle. By late 2009, both the actual rate of inflation and investors’ expectations for future inflation were rising back toward the 2 percent the Fed aims for. The second round, announced in late 2010, helped guide them up further.
Inflation Remains Below the Fed’s Target
Both inflation and inflation expectations remain below the 2 percent annual rate the Fed aims for, despite three rounds of quantitative easing aimed at boosting inflation.


But even with the trillions of dollars pumped into the economy, the Fed has been perpetually unable to get inflation up to the 2 percent level it aims for, except for the occasional brief period. There is good news in that predictions by many Fed critics that Q.E. would unleash vicious hyperinflation have come nowhere close to materializing. But neither has it been enough for the Fed to reach its self-imposed goal.
In an economy trying to get out from under an overhang of debt, where excessive unemployment is the leading problem, too-low inflation can be deeply problematic and hold back growth. Q.E. has not been powerful enough to generate as much inflation as the Fed says it wants.
Where’s the growth?
The good news is that the economy has been growing remarkably steadily since the middle of 2009. There were several moments when pundits warned that a dip back into recession was looming, but none materialized. Fed policy is quite possibly a reason for that; every time a risk of recession seemed to pick up, Mr. Bernanke & Co. cooked up another round of Q.E. that helped avert it.
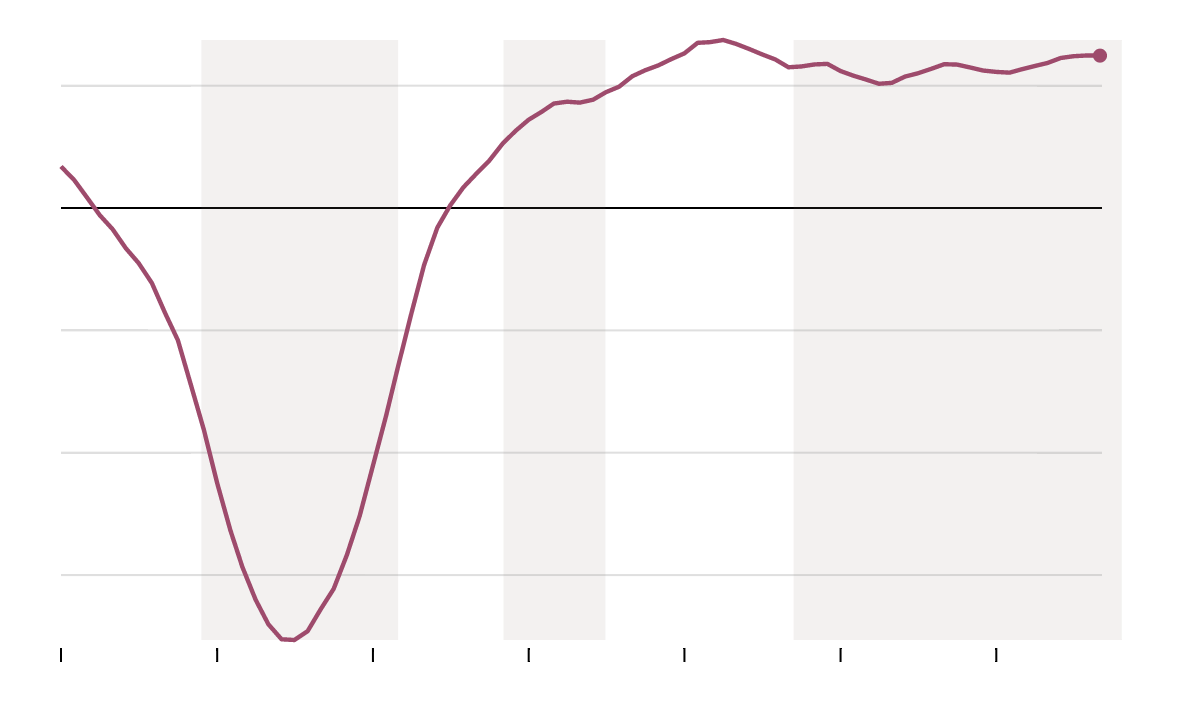
Growth Has Been Too Weak to Return to the Pre-Crisis Trend
Compared to “potential G.D.P.” — the level of output the economy would have at full employment and with factories operating at full capacity — the economy is still coming up short.


Still, the pace of growth has been perpetually disappointing for anyone expecting or betting on a return to the pre-crisis trend.
Compared with the Congressional Budget Office’s estimate of “potential G.D.P.” — the level of output the economy would have if we were at full employment and our factories were cranking at full throttle — we’re still hundreds of billions of dollars short.
The Q.E.-driven recovery has been solid and consistent — but has not been able to push the economy toward a sharp rebound.
The job market tells a similar tale. The third round of Q.E., launched in September 2012, was explicitly targeted at the job market, and was accompanied by an open-ended promise to continue until there was “substantial progress” toward improving the jobs situation. So what has happened?
Job Growth Has Been Steady but Not Extraordinary

There really has been improvement in the rate of job creation. After bouncing along at adding around two million private sector jobs a year in the early years of the recovery, the economy is now accelerating toward the 2.5 million range. Some further acceleration would be welcomed by the jobless, but it seems that the Q.E.-driven recovery is now creating at least somewhat faster job growth.
The impact on jobs is a metaphor for the impact of Q.E. more broadly. It helped the economy recover. But it wasn’t fast and it didn’t solve every problem.